
TL;DR: Haruspex AI analysis on Thursday, July 2, 2026, revealed a decisively bullish market, with 127 out of 192 analyzed stocks exhibiting strong buy signals. Institutional buying pressure and positive technical breakouts are key drivers, suggesting continued upward momentum. Investors should focus on companies with robust institutional support and monitor macro regime thresholds.
On Thursday, July 2, 2026, ET, Haruspex AI detected significant bullish pressure across a broad swath of the U.S. equity market. Out of 192 stocks analyzed, a substantial 127 registered bullish signals, while only 30 showed bearish indicators, and 35 remained neutral. This reflects an underlying positive market sentiment despite a slight dip in the broader index.
The S&P 500 closed at 7,483.23, down a modest 0.22% [data: 2026-07-02 close], while the VIX, a measure of market volatility, remained subdued at 15.99 [data: 2026-07-02 close]. The 10-Year Treasury Yield held at 4.46% [data: 2026-07-02 close], and WTI Crude Oil was priced at $67.58 [data: 2026-07-02 close]. The US Dollar Index (DXY) registered 100.70 [data: 2026-07-02 close].
What Haruspex AI Detected Beyond Conventional Metrics
Haruspex's AI goes beyond traditional financial metrics, employing a multi-dimensional analytical framework to uncover subtle market directional pressures. It scrutinizes data across dimensions like `technical_momentum`, `institutional_flow`, `social_sentiment`, `options_flow`, `competitors`, `earnings`, `short_interest`, and `github_activity` to provide a holistic view of market behavior.
Today's analysis highlights how specific AI dimensions are converging to create strong directional signals. For instance, heightened institutional buying, detected by the `institutional_flow` dimension, frequently correlated with strong `technical_momentum` scores. These interactions often precede significant price movements that conventional analyses might initially overlook.
Haruspex scores represent detected market directional pressure, not company quality ratings. A score of 70+ indicates strong bullish pressure, while 60-69 signifies bullish pressure. Scores between 45-59 suggest no clear directional edge. Conversely, 35-44 denotes bearish pressure, and anything below 35 points to strong bearish pressure. These scores describe market behavior around a stock, not its intrinsic value.
Top Movers: Institutional Flows and Technical Breakouts
Several stocks demonstrated significant bullish pressure today, driven by specific AI dimension movements:
- Palo Alto Networks (PANW): Scored an impressive 86.0, up 6.0 points. This robust bullish pressure was primarily driven by the `technical_momentum` dimension rising to 85, coupled with strong `institutional_flow` at 72. This indicates sustained buying interest from large institutional players reinforcing price trends.
- Delta Air Lines (DAL): Surged to a score of 82.0, marking a 15.0-point increase. Key drivers included the `technical_momentum` dimension at 72, alongside `competitors` and `institutional_flow` both scoring 70. The data suggests strong upward momentum forces and outperformance relative to its peers.
- PNC Financial Services (PNC): Achieved a score of 82.0, up 18.0 points. The `institutional_flow` dimension reaching 72 and `technical_momentum` at 72 were pivotal. Its `competitors` dimension also moved to 68, indicating a strengthening directional edge against its banking sector rivals.
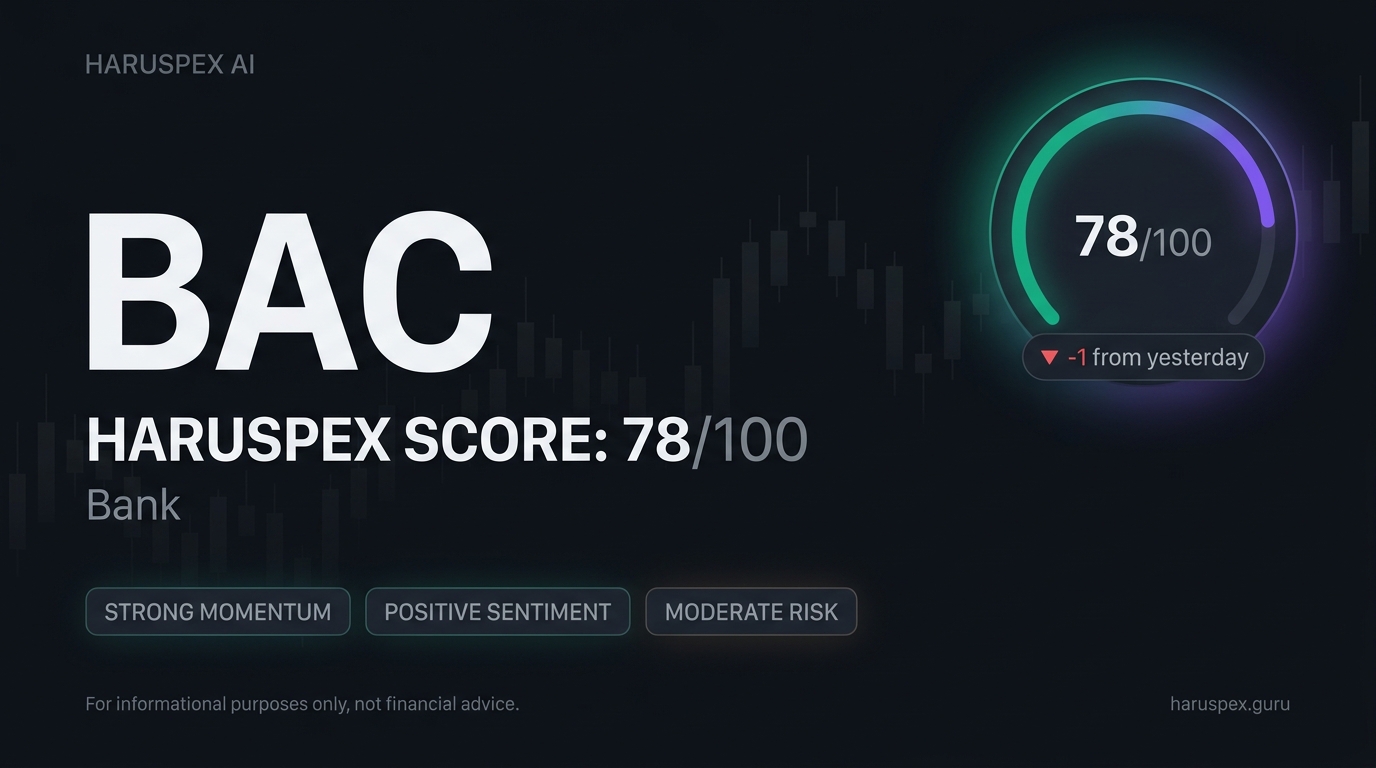
- Bank of America Corp. (BAC): Registered a score of 81.0, a 6.0-point gain. Bullish pressure was underscored by the `short_interest` dimension at 75, suggesting potential for a short squeeze. Positive signals from `earnings` at 72 and `options_flow` at 72 also contributed to this upward momentum.
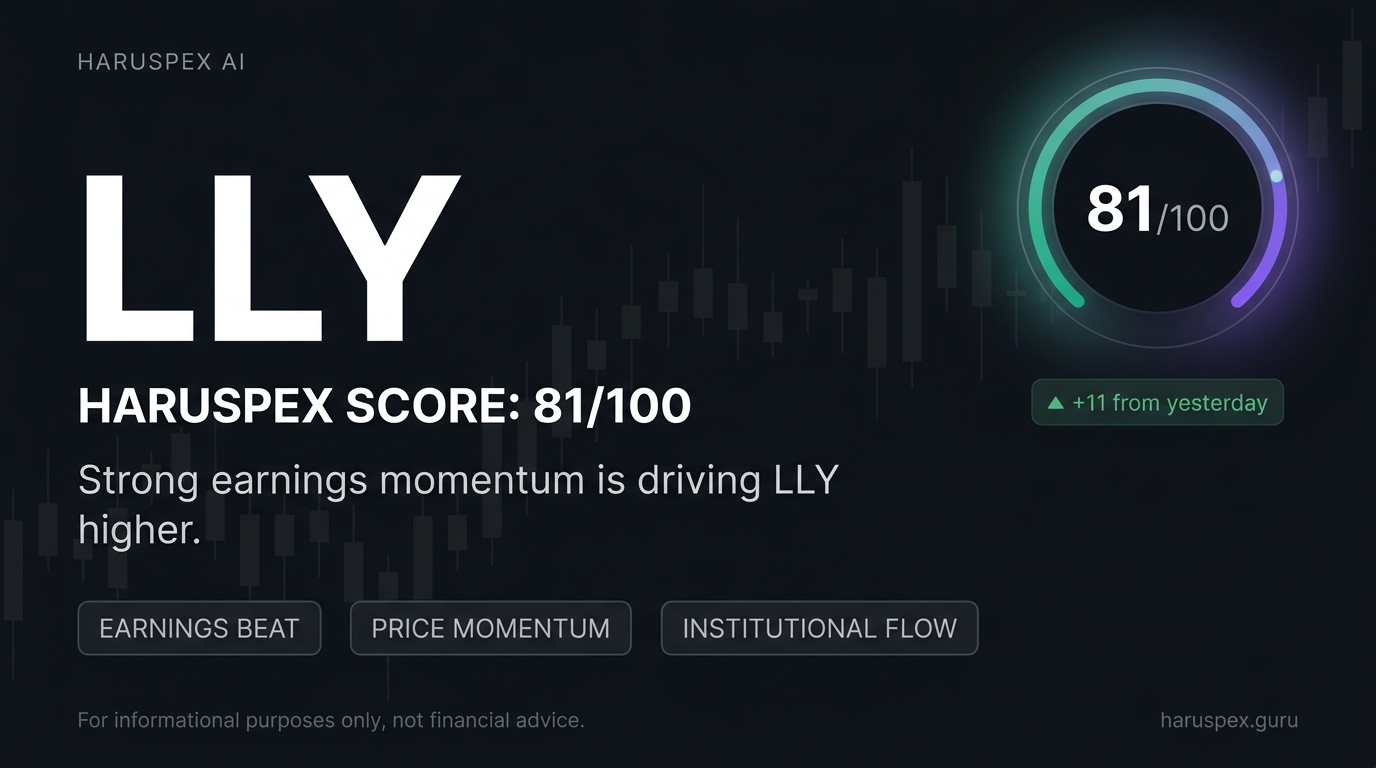
- Eli Lilly and Company (LLY): Held a score of 81.0, up 2.0 points. The `earnings` dimension was particularly strong at 85, reflecting positive market reaction to fundamental strength. The `competitors` dimension at 75 also highlighted its leading position within its industry, alongside solid `institutional_flow` at 68.
- Moderna Inc. (MRNA): Posted an 81.0 score, with a 2.0-point increase. The `technical_momentum` dimension reaching 72 and `institutional_flow` at 70 were significant. Haruspex AI detected that the stock is breaking key pressure resistance zones, often a precursor to further advances.
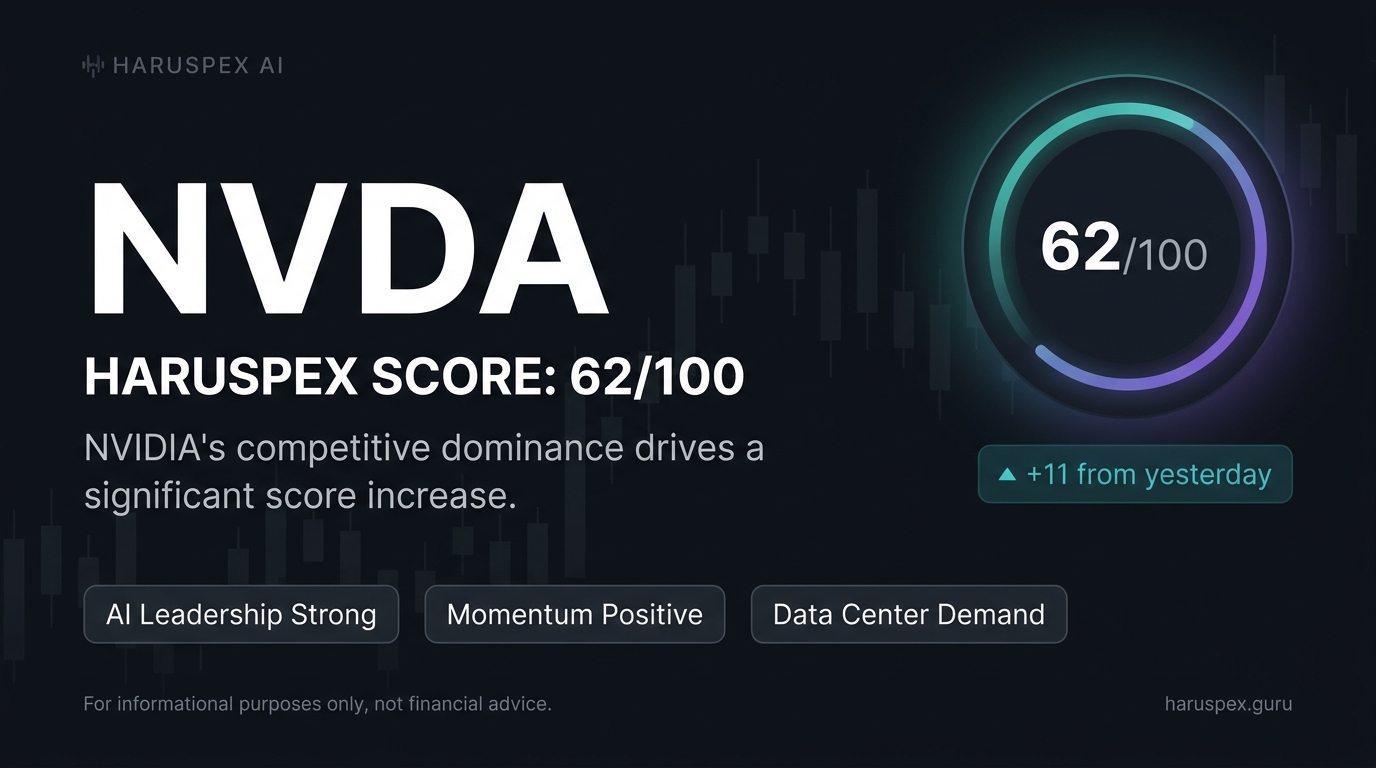
- NVIDIA Corporation (NVDA): Maintained a strong score of 81.0, up 1.0 point. Its `competitors` dimension was exceptionally high at 85, indicating market leadership. Strong `earnings` signals at 72 and elevated `github_activity` at 71 further confirmed robust developer engagement and product pipeline health, contributing to a buyer-seller imbalance favoring bulls.
What do 127 bullish signals mean for market direction?
The high volume of bullish signals, specifically 127 out of 192 analyzed stocks, indicates a broad-based positive sentiment with strong underlying buying conviction. This suggests that positive catalysts, potentially driven by institutional capital and technical breakouts, are gaining traction across various sectors. While the S&P 500 showed a slight retreat, the breadth of positive signals points to resilience and potential for an upward continuation in the near term.
Macro Regime Monitor: Key Thresholds
Understanding the broader market environment is crucial. Haruspex analysis includes monitoring key macro indicators against defined thresholds that could signal a shift in market regimes.
| Metric | Current Value | Key Bullish Threshold | Key Bearish Threshold |
|---|---|---|---|
| S&P 500 | 7,483.23 | Above 7,500 | Below 7,400 |
| VIX | 15.99 | Below 15.00 | Above 18.00 |
| 10Y Treasury Yield | 4.46% | Below 4.30% | Above 4.60% |
| WTI Crude Oil | $67.58 | Below $65.00 | Above $70.00 |
| US Dollar Index (DXY) | 100.70 | Below 100.00 | Above 101.50 |
The current market regime is characterized by a VIX below 16, suggesting low implied volatility. While the S&P 500 dipped slightly, it remains close to its bullish threshold. Sustained levels above these bullish thresholds would reinforce the current positive market sentiment detected by Haruspex AI.
Risk Factors to Consider
Despite the prevailing bullish signals, several risk factors could shift market dynamics. Geopolitical instability remains a significant concern, with any escalation potentially triggering broad market risk aversion. Such events often cause sudden shifts in `social_sentiment` and `options_flow` dimensions.
Furthermore, an unexpected hawkish pivot from central banks, perhaps in response to persistent inflation, could introduce interest rate headwinds. This scenario would impact growth-sensitive sectors and likely suppress `technical_momentum` across the board, particularly for highly leveraged companies.
Finally, a significant downturn in global manufacturing or supply chain disruptions could re-emerge. Such events could depress `supply_chain` dimension scores and weigh heavily on corporate earnings, challenging the current positive outlook derived from `earnings` dimension scores.
What Would Change This View
The current bullish thesis is grounded in strong AI-driven signals, but certain conditions could invalidate this outlook. If the S&P 500 were to close below its 50-day moving average for three consecutive sessions on above-average volume, the broad bullish pressure would be deferred.
A sustained surge in the VIX above 18.00, coupled with increasing bearish `options_flow` across major indices, would signal a significant shift towards risk-off sentiment. This would indicate growing fear and uncertainty, challenging the current market confidence.
Lastly, if a majority of the top-performing stocks, such as PANW, DAL, and PNC, were to see their `institutional_flow` dimensions drop below 50 simultaneously, it would suggest a withdrawal of significant capital. This would erode the foundation of institutional support currently driving much of the bullish pressure.
Forward-Looking Market Outlook
Haruspex AI's analysis indicates a resilient market poised for potential continued upside, driven by strong institutional conviction and robust technical breakouts. The high number of bullish signals across diverse sectors suggests that underlying fundamental and directional forces are favorable.
Investors should prioritize companies exhibiting strong `institutional_flow` and `technical_momentum` scores, as these dimensions are currently showing the most significant positive directional pressure. Prudent monitoring of macro thresholds and identified risk factors remains essential for navigating potential shifts in this dynamic market environment.


