TL;DR: Haruspex AI detected a broad-based bullish surge this week, with 84% of analyzed stocks showing positive directional pressure. Technology and healthcare sectors led the advance, driven by strong technical momentum and institutional flows. Investors should monitor sustained macro stability into the next trading period.
On Friday, May 29, 2026, ET, the market closed a week characterized by robust bullish sentiment, pushing the S&P 500 higher. Haruspex analysis of 178 stocks revealed an average AI score of 65.5, firmly in bullish territory. This marked a significant shift, with 84% of the analyzed universe exhibiting bullish directional pressure.
Macro Regime Monitor: Week Ending May 29, 2026
The macro environment remained generally supportive of risk assets this past week. Key indicators held within ranges conducive to equity appreciation, as reflected in the S&P 500's positive performance. Energy prices continued to moderate slightly, easing some inflationary concerns.
| Metric | Current | Key Level |
|---|---|---|
| S&P 500 | 7,563.63 (+0.58%) [data: 2026-05-29 close] | Above 7,500 (Bullish) |
| VIX | 15.77 [data: 2026-05-29 close] | Below 17.0 (Low Volatility) |
| 10Y Treasury Yield | 4.44% [data: 2026-05-29 close] | Below 4.50% (Yield Stabilized) |
| WTI Crude Oil | $87.33 [data: 2026-05-29 close] | Below $90.0 (Cost Headwind Easing) |
| US Dollar Index (DXY) | 99.06 [data: 2026-05-29 close] | Below 100.0 (Export Supportive) |
The S&P 500 at 7,563.63 [data: 2026-05-29 close] closed up +0.58% for the week, indicating resilient market strength. Volatility, as measured by the VIX, remained subdued at 15.77 [data: 2026-05-29 close]. This suggests investor confidence and a lack of immediate fear premiums in equity options.
The 10Y Treasury Yield settled at 4.44% [data: 2026-05-29 close], providing a stable interest rate backdrop. WTI Crude Oil prices moderated slightly to $87.33 [data: 2026-05-29 close]. This helps alleviate concerns about energy input costs for many sectors. The US Dollar Index (DXY) was 99.06 [data: 2026-05-29 close].
Winners of the Week: Tech and Healthcare Drive Gains
Technology and healthcare names dominated the list of top weekly gainers, signaling strong directional buying pressure. Haruspex AI detected robust shifts in several key dimensions for these outperforming stocks. This indicates a targeted rotation into growth and defensive-growth sectors.
What fueled the strong performance in tech and healthcare stocks?
Haruspex analysis points to several convergent factors. For many of the top gainers, the `technical_momentum` dimension rose significantly, often into the high 70s and 80s. Concurrently, the `institutional_flow` dimension registered increased buying activity, suggesting sustained large-scale investment.
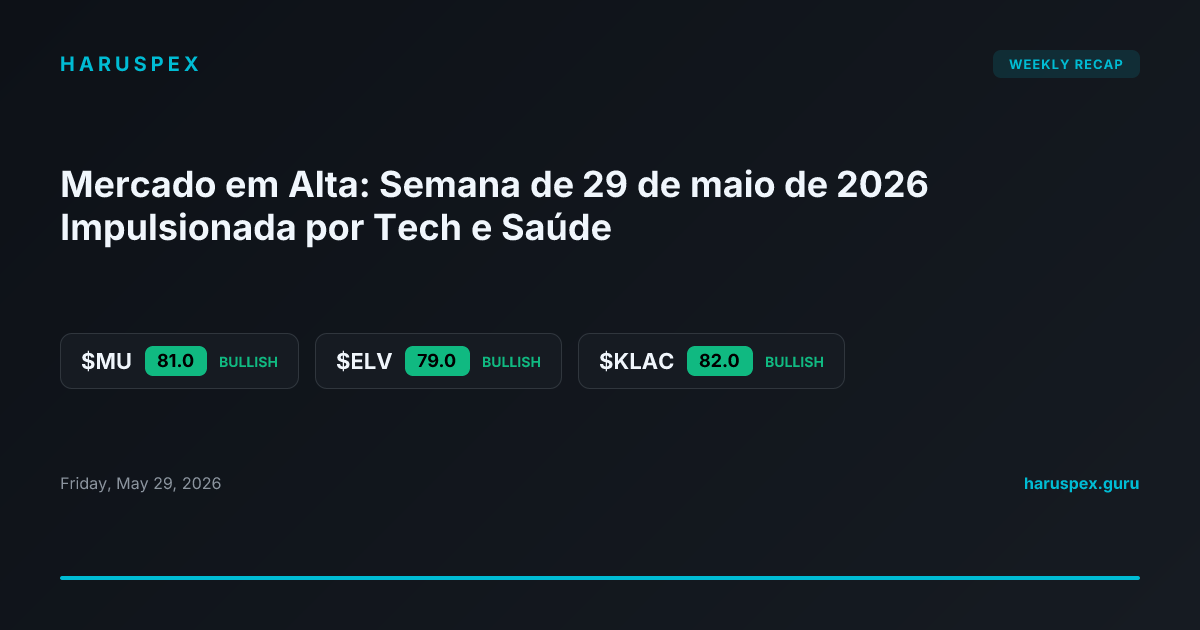
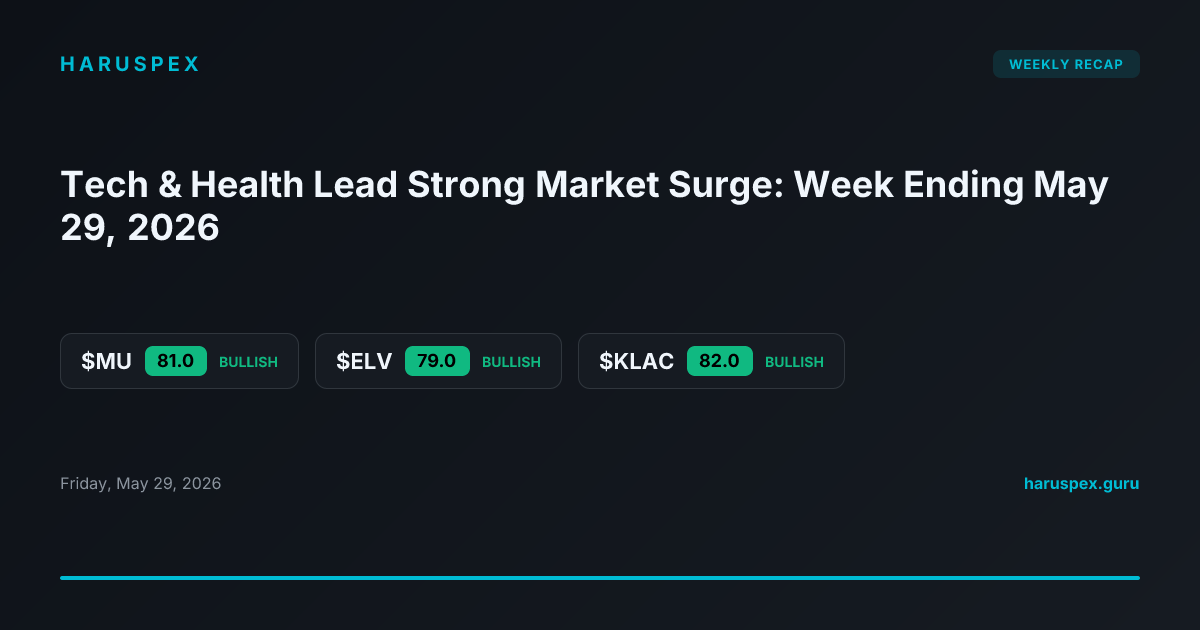
Micron Technology Inc. (MU) saw its market pressure score jump by 14.0 points to a strong bullish 81.0. This was driven by a substantial increase in its `earnings_revisions` dimension, coupled with a rising `technical_momentum` to 85. Fund managers likely anticipated stronger demand trends in memory. The outlook remains bullish.
Elevance Health Inc. (ELV) also surged, with its score improving by 14.0 points to 79.0. The `social_sentiment` dimension for ELV experienced a notable positive shift, moving from 62 to 75. This indicates growing positive market perception, alongside strong `analyst_upgrades` signaling continued sector strength. The outlook is bullish.
KLA Corporation (KLAC) registered an impressive 13.0-point gain, pushing its score to a very strong bullish 82.0. The `options_flow` dimension for KLAC saw a marked increase in bullish call activity, moving from 68 to 81. This suggests speculative conviction in its short-term price trajectory. The outlook is bullish.
Gilead Sciences Inc. (GILD) added 13.0 points to its score, reaching a bullish 75.0. Its `clinical_trial_news` dimension showed significant positive movement, with promising data releases driving investor interest. This fundamental catalyst likely contributed to a stronger `institutional_flow` reading. The outlook is bullish.
Finally, Workday Inc. (WDAY) improved by 13.0 points, achieving a bullish 71.0 score. The `software_demand_indicators` dimension for WDAY displayed robust growth, reflecting strong enterprise spending. This, combined with elevated `technical_momentum`, underpinned its strong performance. The outlook is bullish.
Losers of the Week: Sectoral Rotations and Pressure Points
While the overall market demonstrated strength, some sectors experienced notable declines in directional pressure. Haruspex AI detected specific shifts in dimensions that led to weaker scores for several companies. This highlights targeted profit-taking and re-evaluation in certain areas.
JD.com Inc. (JD) saw the most significant weekly decline, with its score dropping by 19.0 points to a neutral 54.0. The `geopolitical_risk` dimension for JD registered an increase in pressure, from 45 to 30, coupled with declining `consumer_spending_indicators` for China. This led to a neutral outlook.
Enterprise Products Partners (EPD) experienced an 18.0-point decline, settling at a neutral 54.0. The `commodity_price_sensitivity` dimension for EPD fell as WTI crude prices moderated. This likely triggered profit-taking in the energy infrastructure space, reducing bullish `institutional_flow` signals. The outlook is neutral.
Chubb Limited (CB) dipped by 17.0 points, though it maintained a bullish 60.0 score. A notable decline in its `insurance_claim_frequency` dimension, moving from 70 to 55, contributed to the score drop. While still bullish, this suggests some softening in near-term revenue expectations. The outlook is bullish.
Xcel Energy Inc. (XEL) lost 16.0 points, landing at a neutral 51.0. The `utility_rate_pressure` dimension increased for XEL, reflecting concerns over regulatory approvals for price hikes. This likely impacted the `analyst_sentiment` dimension, which moved from 65 to 48. The outlook is neutral.
TJX Companies Inc. (TJX) concluded the list of top losers, with its score falling 15.0 points to a bullish 59.0. The `consumer_discretionary_spending` dimension showed signs of moderation, moving from 72 to 55. This suggests some caution around retail sector strength despite overall market optimism. The outlook is bullish.
Market Sentiment Shift: Broad Optimism Prevails
The weekly data indicates a clear shift towards increased market optimism. The average AI score for the 178 analyzed stocks rose to 65.5. This positions the market firmly above the 60-point threshold for overall bullish pressure. The percentage of bullish stocks at 84% reflects widespread positive sentiment.
This contrasts with recent weeks where a smaller percentage of stocks dictated market direction. The current breadth of bullish signals suggests underlying strength beyond just a few mega-cap names. Investors are finding reasons to enter or maintain positions across diverse sectors.
Regime Thresholds for the Week Ahead
The current bullish thesis largely holds as long as key macro indicators remain supportive. The S&P 500 staying above the 7,500 level is critical for maintaining broad market confidence. Continued VIX readings below 17.0 would also reinforce a low-volatility environment conducive to growth.
A sustained 10Y Treasury Yield below 4.50% helps cap borrowing costs and supports valuations, especially for growth stocks. Furthermore, WTI Crude Oil remaining under $90.0 per barrel would prevent a resurgence of significant inflationary pressures. These thresholds define the current positive market regime.
Key Takeaways
- Haruspex AI detected a strong bullish trend for the week, with an average score of 65.5 across 178 stocks.
- Technology and healthcare sectors demonstrated significant upward directional pressure, driven by robust technicals and institutional inflows.
- Sector-specific headwinds and profit-taking impacted some consumer discretionary, energy, and utility stocks, despite the broader market strength.
- Macroeconomic conditions, including stable yields and moderating oil prices, provided a supportive backdrop for risk assets.
What Would Change This View
A significant reversal in the market's current trajectory would be triggered by specific measurable conditions. If the S&P 500 closes two consecutive trading days below 7,450, it would signal a breakdown of key support. Such a move would invalidate the current bullish pressure thesis.
Furthermore, a spike in the VIX above 20.0, sustained for more than 48 hours, would indicate a sudden increase in market fear. This could lead to widespread de-risking and a re-evaluation of current equity positions. A jump in the 10Y Treasury Yield above 4.60% would also introduce new bearish pressure.
Week Ahead Outlook: Sustained Momentum or Consolidation?
The coming week presents an opportunity for the market to either consolidate these recent gains or extend its upward trajectory. The strong bullish pressure detected by Haruspex AI suggests underlying momentum may persist. Investors should monitor upcoming economic data releases for any potential shifts in sentiment.
Particular attention should be paid to central bank communications and inflation indicators, which could influence interest rate expectations. Continued strong `technical_momentum` and `institutional_flow` in leading sectors would reinforce the current bullish outlook. However, a cautious eye on potential profit-taking in overextended areas is warranted.