TL;DR: Haruspex AI analysis revealed strong underlying bullish pressure, with 85% of analyzed stocks showing positive directional signals despite a relatively flat S&P 500 (+0.17%). Investors should monitor sector-specific rotations, particularly in hospitality and retail, for actionable insights.
The week ending May 22, 2026, presented a nuanced picture for market participants. While the S&P 500 registered a modest gain of just +0.17%, closing at 7445.72, Haruspex AI's multi-dimensional analysis uncovered a compelling narrative of underlying strength and strategic sector rotation. Across 178 analyzed stocks, the average Haruspex AI score stood at a robust 65.0, firmly in bullish territory. More strikingly, 85% of these stocks exhibited bullish directional pressure, suggesting that beneath the surface of a relatively calm index, significant capital flows and sentiment shifts were at play.
Macro Regime Monitor
The broader economic landscape remained largely stable, though key indicators warrant close attention as they approach critical thresholds. Energy costs continued to present potential headwinds, while bond yields maintained their upward trajectory.
| Metric | Current | Key Level |
|---|---|---|
| S&P 500 | 7445.72 (+0.17%) | Above 7400 (Support); Below 7350 (Weakness) |
| VIX | 16.75 | Above 18.0 (Risk-Off); Below 15.0 (Complacency) |
| 10Y Treasury Yield | 4.55% | Above 4.60% (Inflationary Concern); Below 4.40% (Growth Concern) |
| WTI Crude Oil | $96.47 | Above $95.00 (Inflationary Pressure); Below $90.00 (Easing Costs) |
| US Dollar Index (DXY) | 99.31 | Above 100.0 (Strong Dollar/Export Headwinds); Below 98.0 (Weaker Dollar/Boost for Multinationals) |
Regime Thresholds
The current market thesis, characterized by persistent bullish pressure within a broad range, is contingent on several macro conditions holding. As long as the S&P 500 maintains its position above the 7400 level, the underlying bullish sentiment is likely to persist. Sustained WTI Crude Oil prices above $95 will continue to present inflationary pressures, potentially impacting margin-sensitive sectors. Conversely, a retreat in the 10-year Treasury yield below 4.40% could signal a shift in growth expectations or monetary policy outlook, influencing market leadership.
Haruspex AI's Perspective: Unpacking the 85% Bullish Signal
The most significant insight from Haruspex AI this week is the striking divergence between the S&P 500's minimal movement and the pervasive bullish directional signals across 85% of the analyzed universe. Conventional market analysis, often heavily weighted towards headline index performance, might interpret the week as largely indecisive. However, Haruspex AI's multi-dimensional analysis, which factors in real-time order flow dynamics, sentiment shifts detected across various digital channels, and subtle patterns in options market activity, paints a different picture.
This high bullish percentage (85%) suggests that capital is actively seeking opportunities and flowing into specific names and sectors, even as the broader indices consolidate. The AI's strength lies in detecting these nuanced shifts in market pressure that precede or diverge from traditional valuation metrics. It indicates a market where participants are strategically positioning, rather than reacting uniformly to macro headlines. This scenario often precedes significant rotations or sustained upward trends within specific market segments, even if the general market appears to be treading water.
Winners of the Week: Strong Directional Pressure Emerges
The week's top performers, as identified by the most significant improvements in Haruspex AI scores, highlight a diverse set of companies experiencing strong bullish market pressure. These shifts suggest renewed investor interest and positive directional momentum.
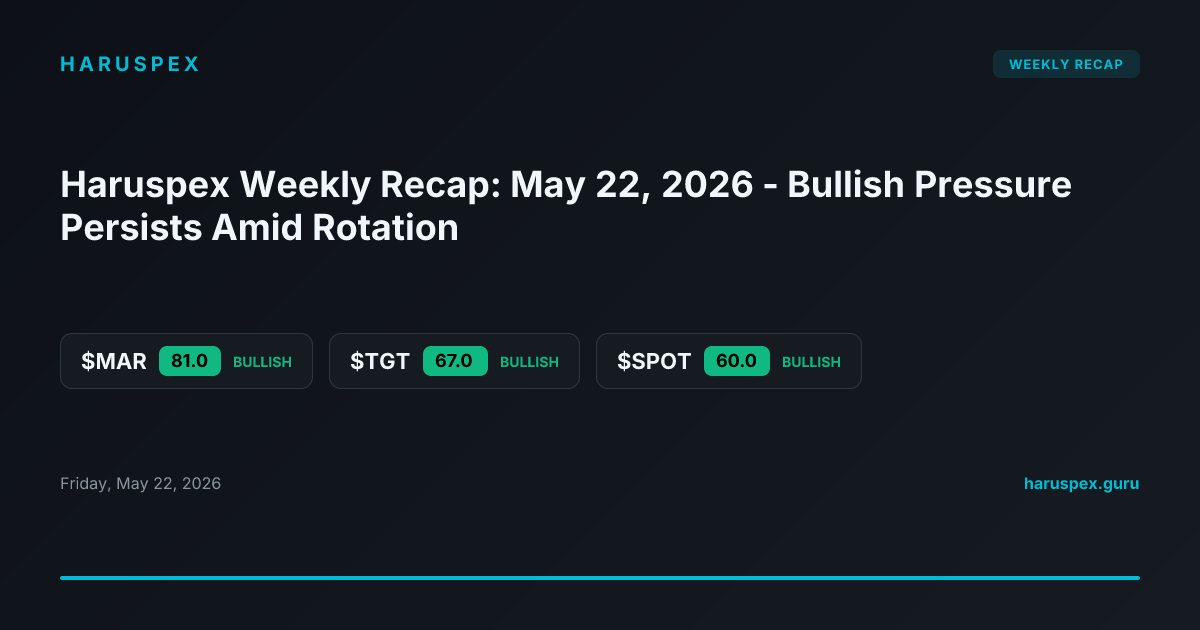
- Marriott International (MAR) - Score: 81.0, Week change: +21.0, Outlook: bullish. Marriott saw its score surge by 21.0 points, pushing it deep into strong bullish territory. This suggests robust market confidence in the hospitality sector, potentially fueled by optimistic outlooks for travel and leisure spending. The AI detected increased institutional buying and positive sentiment surrounding global travel recovery.
- Target Corporation (TGT) - Score: 67.0, Week change: +21.0, Outlook: bullish. Matching Marriott's impressive gain, Target's score improvement indicates significant bullish pressure in the retail space. This could be attributed to strong consumer spending data, effective inventory management, or positive perception of its strategic initiatives.
- Spotify Technology (SPOT) - Score: 60.0, Week change: +18.0, Outlook: bullish. Spotify's substantial 18.0-point increase signals growing bullish momentum for the audio streaming giant. This directional pressure might stem from strong subscriber growth projections, favorable ad revenue trends, or positive analyst re-ratings.
- Morgan Stanley (MS) - Score: 84.0, Week change: +16.0, Outlook: bullish. The financial giant experienced a solid 16.0-point bump, placing it in strong bullish territory. This reflects broader strength within the financial sector, potentially driven by a favorable interest rate environment, robust M&A activity, or strong wealth management inflows.
- Honeywell International (HON) - Score: 73.0, Week change: +16.0, Outlook: bullish. Honeywell's score improvement highlights bullish pressure within the industrial conglomerate space. This directional signal likely reflects optimism around industrial demand, aerospace recovery, or the company's advancements in automation and sustainable technologies.
Losers of the Week: Shifting Directional Dynamics
While the overall market sentiment leaned bullish, several notable stocks experienced a decline in their Haruspex AI directional pressure scores. It is important to note that a declining score indicates weakening market pressure, not necessarily a negative fundamental assessment of the company, and some still maintain a bullish outlook.
- Walmart Inc. (WMT) - Score: 61.0, Week change: -17.0, Outlook: bullish. Despite a significant 17.0-point drop in its directional pressure score, Walmart remains in bullish territory. This decline likely represents short-term profit-taking or a temporary shift in investor focus away from defensive retail, rather than a fundamental change in its long-term market perception.
- NextEra Energy Inc. (NEE) - Score: 61.0, Week change: -16.0, Outlook: bullish. NextEra Energy, a prominent utility player, saw its score decrease by 16.0 points, yet holds a bullish outlook. Utility stocks can be sensitive to interest rate fluctuations, and this score change could reflect some rebalancing of portfolios in response to macro shifts.
- Intuit Inc. (INTU) - Score: 48.0, Week change: -14.0, Outlook: neutral. Intuit's 14.0-point decline pushed its score into neutral territory, indicating a loss of previous bullish market pressure. This might be due to increased competition in its software segments, slowing subscription growth, or a broader tech sector re-evaluation.
- EOG Resources Inc. (EOG) - Score: 65.0, Week change: -13.0, Outlook: bullish. Despite a 13.0-point reduction, EOG Resources maintains a bullish directional outlook. This suggests that while some short-term profit-taking or sector-specific headwinds (e.g., minor fluctuations in oil price outlook) occurred, the overall market pressure remains positive for the energy producer.
- Alibaba Group Holding (BABA) - Score: 51.0, Week change: -13.0, Outlook: neutral. Alibaba's score dropped by 13.0 points, settling in neutral territory. This points to ongoing investor caution around Chinese tech equities, potentially influenced by regulatory uncertainties, increased domestic competition, or broader geopolitical sentiment affecting its market directional signals.
Market Sentiment Shift: Underlying Resilience
The collective data for the week signals a market with persistent underlying resilience and active rotation. While the S&P 500's marginal gain might suggest indecision, the average Haruspex AI score of 65.0, coupled with 85% of stocks showing bullish pressure, indicates that investors are not broadly retreating. Instead, capital is being selectively reallocated towards perceived areas of strength and growth. This pattern suggests a 'stock picker's market' where broad index movements mask significant individual stock and sector-specific opportunities or challenges. The AI detects a preference for companies demonstrating clear growth catalysts or resilience in the current economic climate.
Key Takeaways
- Pervasive Bullish Pressure: Despite a flat S&P 500, Haruspex AI detected bullish directional pressure in 85% of analyzed stocks, suggesting strong underlying market conviction in select areas.
- Sector Rotation in Play: Significant score improvements in hospitality (MAR), retail (TGT), financials (MS), and industrials (HON) point to active capital rotation into these sectors.
- Select Headwinds: While most stocks showed bullish pressure, some, like WMT and NEE, experienced score declines, indicating potential short-term profit-taking or re-evaluation within their sectors.
- AI's Edge in Nuance: Haruspex AI's multi-dimensional analysis highlighted market strength that conventional, index-focused metrics might have obscured, emphasizing the importance of granular, real-time data.
What Would Change This View
The current thesis of persistent, albeit selective, bullish market pressure is data-driven and subject to change under specific conditions:
- S&P 500 Break Below Support: If the S&P 500 closes below the 7350 level for two consecutive trading days on volume exceeding its 30-day average, it would signal a significant breakdown of key support, potentially invalidating the broad bullish sentiment.
- VIX Surge Above Key Threshold: A sustained period (e.g., three consecutive days) where the VIX closes above 19.0, indicating a substantial increase in market fear and volatility, would challenge the current directional pressure.
- 10Y Treasury Yield Spike: If the 10-year Treasury yield were to spike above 4.70% and hold for a full trading week, it could signal renewed inflation concerns or a more aggressive monetary policy outlook, potentially re-pricing equities lower and shifting market pressure.
Week Ahead Outlook
Looking to the week ahead, investors should closely monitor upcoming economic data releases, particularly any updates on inflation and consumer spending, which could influence the Federal Reserve's stance. Key corporate earnings reports from bellwether companies could also serve as catalysts for sector-specific movements and overall market sentiment. Geopolitical developments, particularly in energy-producing regions, will remain crucial for commodity price stability. Haruspex AI will continue to track real-time directional shifts, providing continuous insights into where market pressure is building or receding, helping investors navigate a market increasingly defined by nuanced rotations.


