
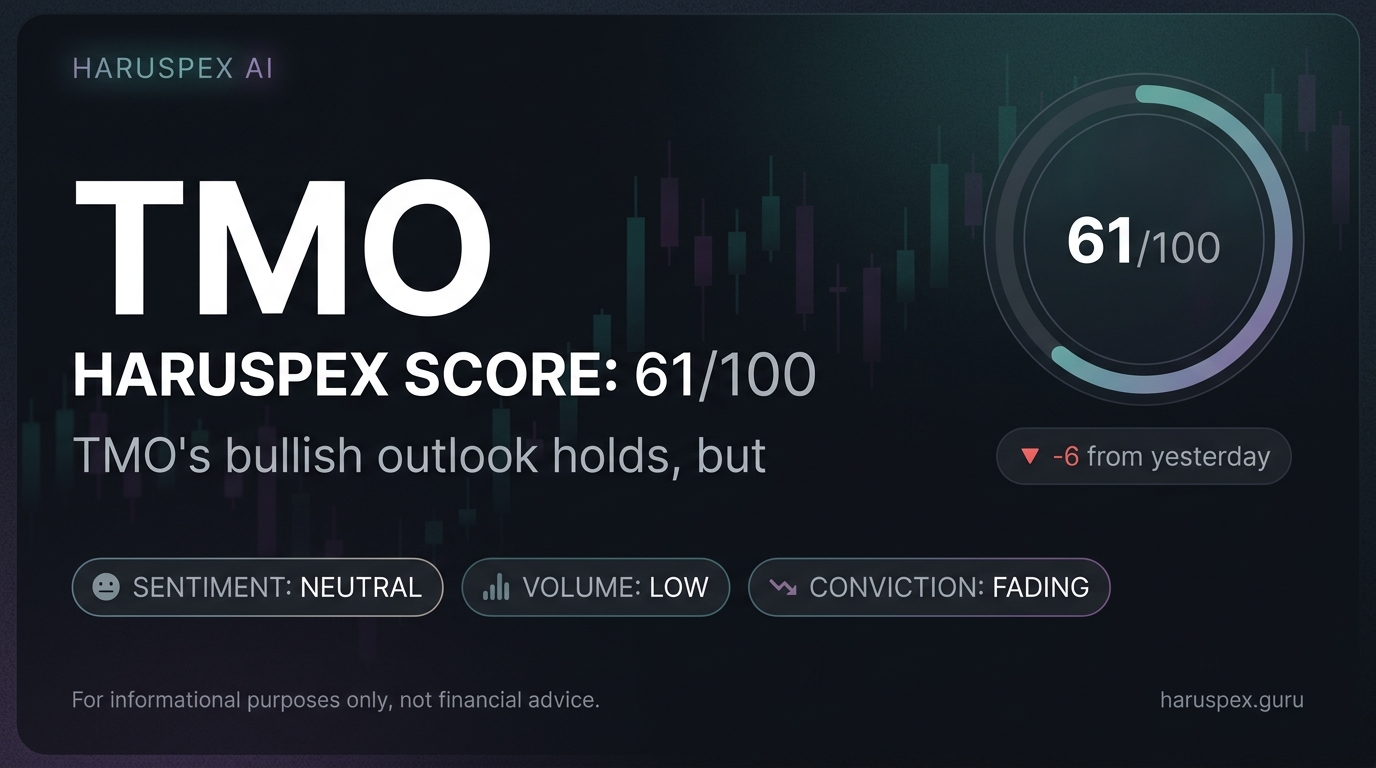
TL;DR: Haruspex data indicates a significant increase in bullish market pressure for TMO, with its overall score rising to 74.0. This surge is primarily fueled by strong buy flow detected within the microstructure dimension, suggesting conviction among market participants.
On 2026-09-17 ET, Thermo Fisher Scientific (TMO) closed at $653.87 [data: 2026-09-17 close], marking a 0.83% gain for the day and approaching its 52-week high of $658.40. Haruspex analysis shows the overall market pressure score for TMO climbing to 74.0, a notable 5.0-point increase from its previous score of 69.0.
Data Signals Strong Buying in TMO
The primary driver behind TMO's elevated market pressure is its microstructure dimension, which currently registers a robust 78/100. This score indicates strong bullish pressure specifically from real-time order flow dynamics. Haruspex data detected 70% buy flow within TMO, occurring on volume 160% above the average.
Such a pronounced imbalance towards buying, coupled with higher-than-normal volume, signals aggressive accumulation of shares. This suggests that market participants are actively positioning themselves, creating upward directional pressure on the stock. Monitoring for sustained buy flow and follow-through volume will be crucial.
What did Haruspex analysis detect that conventional screens might miss?
While traditional volume analysis can identify periods of high trading activity, it often struggles to quantify the directional conviction within that volume. Haruspex's microstructure dimension provides a granular look at the precise buy and sell order execution, enabling the detection of aggressive buy flow — a detail that can be masked by simple total volume figures or basic price-action screens.
The convergence of multiple dimensions above the 60-point threshold for TMO also creates a more comprehensive picture. While microstructure (78) is the strongest, institutional (65), short-interest (65), technical (65), earnings (64), options-flow (63), competitors (62), and sentiment (62) all contribute to the broad bullish signal. A single-factor screen might only catch a technical breakout or earnings surprise, missing the underlying flow dynamics.
Macro Environment Snapshot
The broader market currently offers a mixed but generally supportive backdrop for equities, as indicated by the latest closing figures.
| Metric | Current | Key Level |
|---|---|---|
| S&P 500 | 7637.54 (+1.14%) [data: 2026-09-17 close] | 7600 |
| VIX | 15.42 [data: 2026-09-17 close] | 20 |
| 10Y Treasury Yield | 4.95% [data: 2026-09-17 close] | 5.00% |
| WTI Crude Oil | $100.38 [data: 2026-09-17 close] | $110.00 |
| US Dollar Index (DXY) | 100.10 [data: 2026-09-17 close] | 102.00 |
Regime Thresholds for Life Sciences
For a company like Thermo Fisher Scientific, operating in the life sciences sector, certain macro conditions can act as either headwinds or tailwinds. As long as the 10-Year Treasury Yield remains below 5.25%, the cost of capital pressures are contained for growth-oriented companies. A sustained move above this threshold could introduce increased discount rates for future earnings projections and elevate borrowing costs.
WTI Crude Oil holding below $110 per barrel helps mitigate significant increases in raw material and logistics expenses for large-scale operations. A breach of this level could translate into higher operational costs that may pressure margins. Furthermore, a stable S&P 500 above 7600 provides a supportive equity market environment, reducing broader risk aversion that might otherwise impact sector-specific investments.
Outlook for TMO
The current Haruspex data points to a bullish directional signal for TMO. The robust microstructure score of 78, reflecting aggressive buy flow, indicates strong near-term interest from market participants. This is supported by generally bullish pressure across all other analyzed dimensions, none falling into a weak category.
While the overall market sentiment and technicals also show bullish pressure, the explicit conviction highlighted by the microstructure dimension makes TMO stand out. Investors will look for continued price strength and consistent volume to confirm the durability of this buying interest as TMO approaches its 52-week high.
Risk Factors to Consider
Despite the strong overall bullish signal, no investment is without risk. While no dimensions are currently scoring below 40, some dimensions for TMO, such as sentiment (62), competitors (62), and options-flow (63), are closer to the neutral 50-point mark. A significant negative shift in these areas, perhaps driven by broader market news or company-specific developments, could dilute the overall bullish pressure.
Additionally, while the 10-Year Treasury Yield at 4.95% is currently below a critical threshold, a rapid or sustained increase in interest rates could negatively impact valuations in the life sciences sector. Geopolitical events or unexpected regulatory changes impacting the healthcare and scientific research industries also present potential risks.
What Would Change This View
The current bullish thesis for TMO could be invalidated or significantly tempered by several specific, measurable conditions. If the microstructure dimension score for TMO drops below 50, particularly if accompanied by a marked increase in detected sell flow and below-average volume, it would signal a reversal in current market conviction.
Another indicator would be if TMO closes a full week below the $620 price level on above-average trading volume. Such a move would suggest a breakdown of recent support and negate the current bullish price action. Finally, a substantial and sustained downturn in the broader market, evidenced by the S&P 500 closing below 7500 for multiple sessions concurrently with the VIX rising above 20, could lead to a general risk-off sentiment that impacts even fundamentally strong stocks like TMO.


