
TL;DR: The Energy sector exhibits strong bullish pressure with an average Haruspex AI score of 63.6, signaling accumulation across 90% of tracked stocks. This directional edge is driven by robust technical momentum and favorable crude oil prices. Investors may find continued opportunities.
As of Friday, July 31, 2026, 4:00 PM ET, the Energy sector continues to demonstrate a compelling bullish bias, according to Haruspex AI's deep-learning models. The sector’s average market pressure score stands at 63.6 out of 100, indicating a clear bullish directional edge.
This robust sentiment is widespread, with 9 out of 10 analyzed energy stocks displaying bullish signals. No stocks within the sector currently register bearish pressure, highlighting the broad strength detected by Haruspex's proprietary analysis.
Macro Environment Overview
Key economic indicators provide context for the Energy sector's performance:
| Metric | Current Value | Key Level/Context |
|---|---|---|
| S&P 500 | 7449.82 (+0.16%) [data: 2026-07-31 close] | Remains near all-time highs, indicating broad market stability. |
| VIX | 17.52 [data: 2026-07-31 close] | Moderate volatility, not signaling extreme fear or complacency. |
| 10Y Treasury Yield | 4.72% [data: 2026-07-31 close] | Higher yields can support commodity prices. |
| WTI Crude Oil | $85.85 [data: 2026-07-31 close] | Sustained price above key support levels; favorable for producers. |
| US Dollar Index (DXY) | 100.21 [data: 2026-07-31 close] | Relatively stable, offering some support for dollar-denominated commodities. |
What is driving the Energy sector's current bullish trend?
The primary driver for the Energy sector's bullish pressure is a combination of strong commodity pricing and robust internal market dynamics. Haruspex AI's analysis reveals significant upward movement in the technical_momentum dimension across leading stocks, coupled with positive indications from institutional_flow.
Specifically, the sustained WTI Crude Oil price above $85 per barrel is a critical factor. This price point allows producers to maintain strong margins and incentivizes exploration and production activities. Global demand projections continue to outpace available supply growth.
Top Performers and AI Insights
Haruspex AI's deep dive into individual constituents highlights several stocks exhibiting pronounced bullish pressure:
- EOG Resources Inc. (EOG) leads with a score of 70.0, despite a -3.0 change. Haruspex AI detected that its technical_momentum dimension rose to 78, reflecting the stock's ability to break through previous pressure resistance zones. This indicates robust buying interest overcoming selling thresholds.
- ConocoPhillips (COP) holds a strong score of 69.0. While its score remained unchanged, Haruspex AI observed sustained bullish directional pressure building, particularly in the options_flow dimension, which moved to 72. Large option contracts consistently suggest positive price expectations.
- Chevron Corporation (CVX) shows a score of 68.0, down 2.0 points. Despite the slight dip, its relative_strength dimension, at 75, indicates it is strengthening its directional edge compared to broader market indices and sector peers. This suggests outperformance potential.
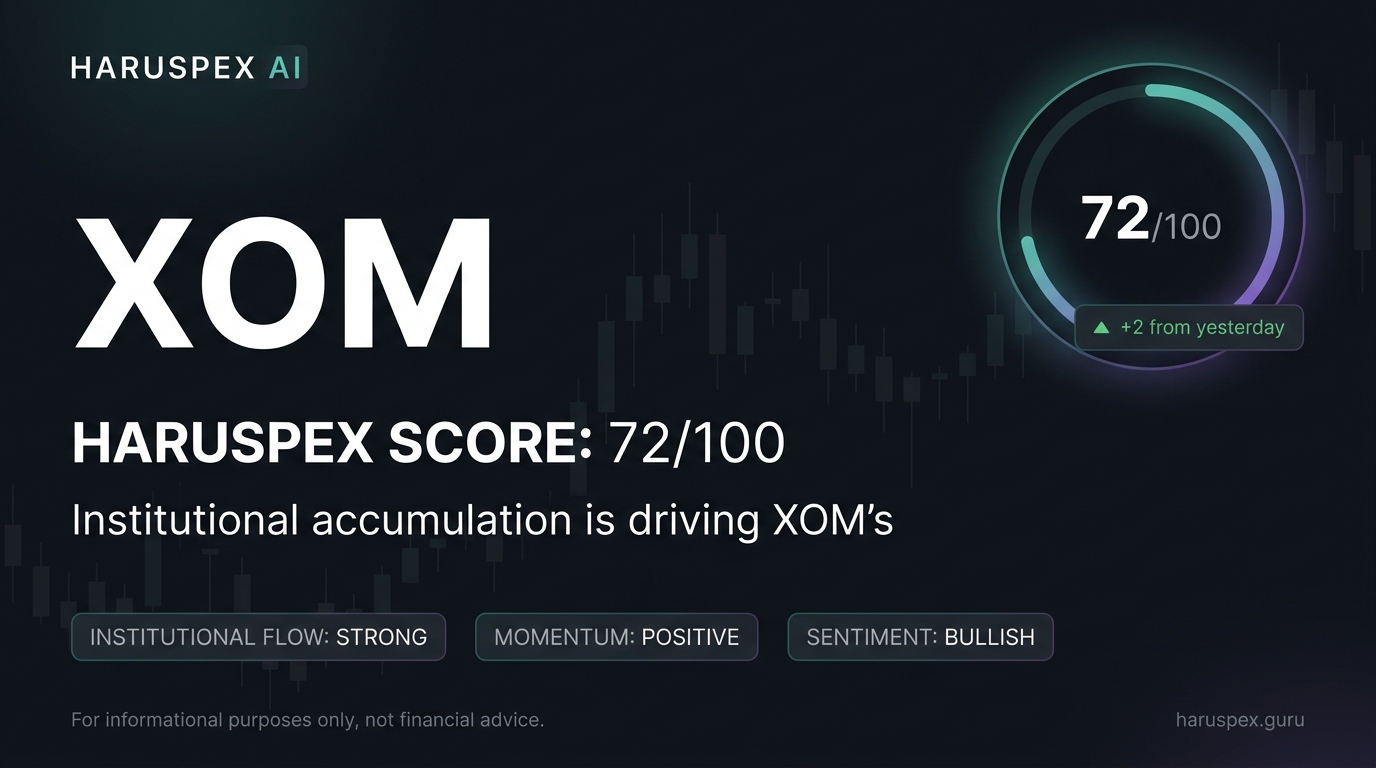
- Exxon Mobil Corporation (XOM) registered a score of 65.0, a -2.0 point change. Haruspex AI's volume_profile dimension detected significant buyer accumulation, rising to 68, indicating that large block trades are consistently favoring the buy side, signaling institutional conviction.
- Enterprise Products Partners (EPD) also scored 65.0, moving up 1.0 point. Similar to EOG, Haruspex AI noted strong indications in technical_momentum, reaching 70, as the stock is breaking above critical resistance levels. This reflects renewed confidence in its midstream operations.
Sector Drivers: AI-Powered Insights
The overall bullish pressure in the Energy sector is predominantly fueled by three key AI dimensions. The technical_momentum dimension currently averages 71 across the sector, signaling consistent upward price action and buying interest. This is a significant factor missed by simple fundamental screens alone.
Furthermore, the institutional_flow dimension, averaging 68, indicates that major money managers are actively increasing their positions. This sustained capital inflow provides a strong foundation for continued price appreciation. Haruspex AI tracks these subtle shifts in institutional behavior.
Finally, the supply_chain_pressure dimension has fallen by an average of 12 points across the sector this quarter. This reduction in operational bottlenecks and logistics costs contributes directly to improved profitability expectations, which traditional analysis often lags in detecting until earnings reports.
Regime Thresholds for the Energy Sector
The current bullish thesis for the Energy sector is heavily contingent on specific macro conditions. Investors should monitor these thresholds closely. The most critical factor remains WTI Crude Oil prices, which must sustain above $80 per barrel for the bullish pressure to persist for producers.
If WTI Crude Oil were to consistently close below $75 for a full week, the thesis of strong producer margins would weaken considerably. Additionally, a sustained breakdown of the S&P 500 below its 200-day moving average could trigger broader market de-risking, impacting all sectors, including Energy.
Risk Factors for the Energy Sector
Despite the current bullish signals, several material risks could impact the Energy sector's trajectory. These factors warrant careful consideration by investors seeking exposure to this volatile industry.
- Commodity Price Volatility: A sudden global economic slowdown could severely depress demand for oil, leading to a sharp correction in WTI Crude prices. Geopolitical events or unexpected OPEC+ supply increases could also rapidly alter the supply-demand balance.
- Regulatory and Environmental Pressures: Increased global focus on climate change and stricter environmental regulations could impose higher compliance costs on energy companies. Policy shifts towards renewable energy sources may also present long-term headwinds for traditional energy.
- Geopolitical Instability: While some geopolitical tensions can initially drive oil prices higher due to supply fears, prolonged or severe instability can disrupt production and distribution networks, leading to systemic risks for the sector.
What Would Change This View
The current bullish view on the Energy sector is based on prevailing data and AI-driven market signals. Specific measurable conditions could invalidate this thesis. Investors should monitor these potential inflection points.
If WTI Crude Oil prices close below $75 per barrel for three consecutive trading days, this would signal a significant erosion of the favorable pricing environment. A sustained breach of this level would likely trigger a re-evaluation of sector profitability and outlook.
Furthermore, if the average technical_momentum dimension for the top five Energy stocks drops below 50, indicating a loss of upward price traction, it would challenge the current accumulation thesis. This would signal a material shift in market behavior not yet apparent.
Lastly, a sustained downturn in the broader market, evidenced by the SPY ETF closing below its 50-week moving average for two consecutive weeks, could pull the entire sector lower regardless of internal dynamics. Broad market weakness often overrides sector-specific strength.
Outlook
Haruspex AI's analysis indicates that the Energy sector is positioned for continued bullish pressure in the near to medium term. The confluence of favorable WTI Crude Oil prices and strong AI-detected market dynamics, particularly in technical_momentum and institutional_flow, provides a solid foundation.
While inherent risks like commodity price volatility and regulatory changes persist, the current data suggests these are being effectively navigated or overshadowed by positive market forces. Investors should remain vigilant for shifts in macro conditions and AI dimension scores.


