
TL;DR: Haruspex data for September 25, 2026, indicates a rising bullish directional pressure across the market, primarily driven by a significant increase in the Regulatory dimension score. With 58% of analyzed stocks showing bullish signals, investors should monitor sector-specific regulatory shifts while noting strong bearish pressure from Insider-Trading.
On 2026-09-25 ET, Haruspex data detected a market with increasing bullish directional pressure, marked by notable shifts in several key dimensions. The overall market-wide average score stood at 57.0 out of 100, signaling a neutral but slightly bullish leaning environment, with 58% of the 890 analyzed stocks exhibiting bullish pressure.
Macro Regime Monitor
The broader economic context indicates a moderately positive landscape, yet with persistent inflation concerns reflected in Treasury yields. These figures establish the backdrop against which specific stock movements are playing out.
| Metric | Current | Key Level |
|---|---|---|
| S&P 500 | 7734.52 (+0.39%) [data: 2026-09-25 close] | 7700 (short-term support) |
| VIX | 15.46 [data: 2026-09-25 close] | 15 (volatility threshold) |
| 10Y Treasury Yield | 5.21% [data: 2026-09-25 close] | 5.00% (key resistance) |
| WTI Crude Oil | $94.08 [data: 2026-09-25 close] | $90 (supply concern level) |
| US Dollar Index (DXY) | 101.08 [data: 2026-09-25 close] | 100 (psychological support) |
Dominant Trends in Market Pressure
Haruspex analysis reveals a distinct bullish tilt across several key dimensions this week. The Institutional dimension recorded an average score of 61.4, indicating bullish pressure from large capital flows. Similarly, Short-Interest carried an average score of 61.1, suggesting a reduction in bearish positioning.
The Sentiment dimension also showed bullish pressure at an average of 60.5. This broadly positive sentiment, combined with institutional activity, underpins the market's current directional momentum. Prominent stocks like INTC and GL were noted for their strong Sentiment and Short-Interest signals.
The most significant shift was observed in the Regulatory dimension, which saw its average score increase by a notable +1.7 points, reaching 61.4. This upward movement into bullish territory suggests an improving regulatory environment or positive anticipation around policy developments for various sectors. Top stocks reflecting this heightened regulatory pressure include AAPL, MA, and TSLA.
Additional dimensions showing an increase in bullish pressure include Management, which rose by +0.3 points to an average of 51.3, and Climate-Risk, which nudged up by +0.1 points to 52.7. These subtle shifts contribute to the overall directional signals detected by Haruspex. Companies like LLY, prominent across several dimensions from Competitors (56.1) to Supplychain (54.0), also reflect these evolving pressures.
What the Data Shows
The consistent bullish pressure across Institutional, Regulatory, Short-Interest, and Sentiment dimensions points to a market absorbing recent macroeconomic data and translating it into positive price action. This indicates that major market participants and the broader sentiment are aligning on a constructive near-term outlook, despite underlying yield concerns.
The significant climb in the Regulatory dimension suggests that anticipated or recently enacted regulations are being perceived as favorable by the market. This could involve reduced compliance burdens, new opportunities opening up, or clearer frameworks that decrease uncertainty. Such clarity often translates into increased investor confidence.
What does rising Regulatory pressure mean for market leaders?
Rising regulatory pressure, when moving into bullish territory, often means that the operating environment for large, established companies is becoming more predictable or even more advantageous. For leaders such as AAPL and TSLA, this could indicate favorable policy shifts in areas like intellectual property, market access, or sector-specific guidelines, potentially reducing headwinds or fostering innovation within established frameworks. Companies like DT, from the Options-Flow top stocks, are also part of this broader shift, demonstrating market responses to these changing conditions.
Regime Thresholds
The current thesis of building bullish pressure remains robust under specific market conditions. As long as the S&P 500 maintains its position above the 7700 level on a weekly closing basis, the underlying positive sentiment is likely to persist. A VIX below 16 suggests market participants are not pricing in significant immediate downside risk.
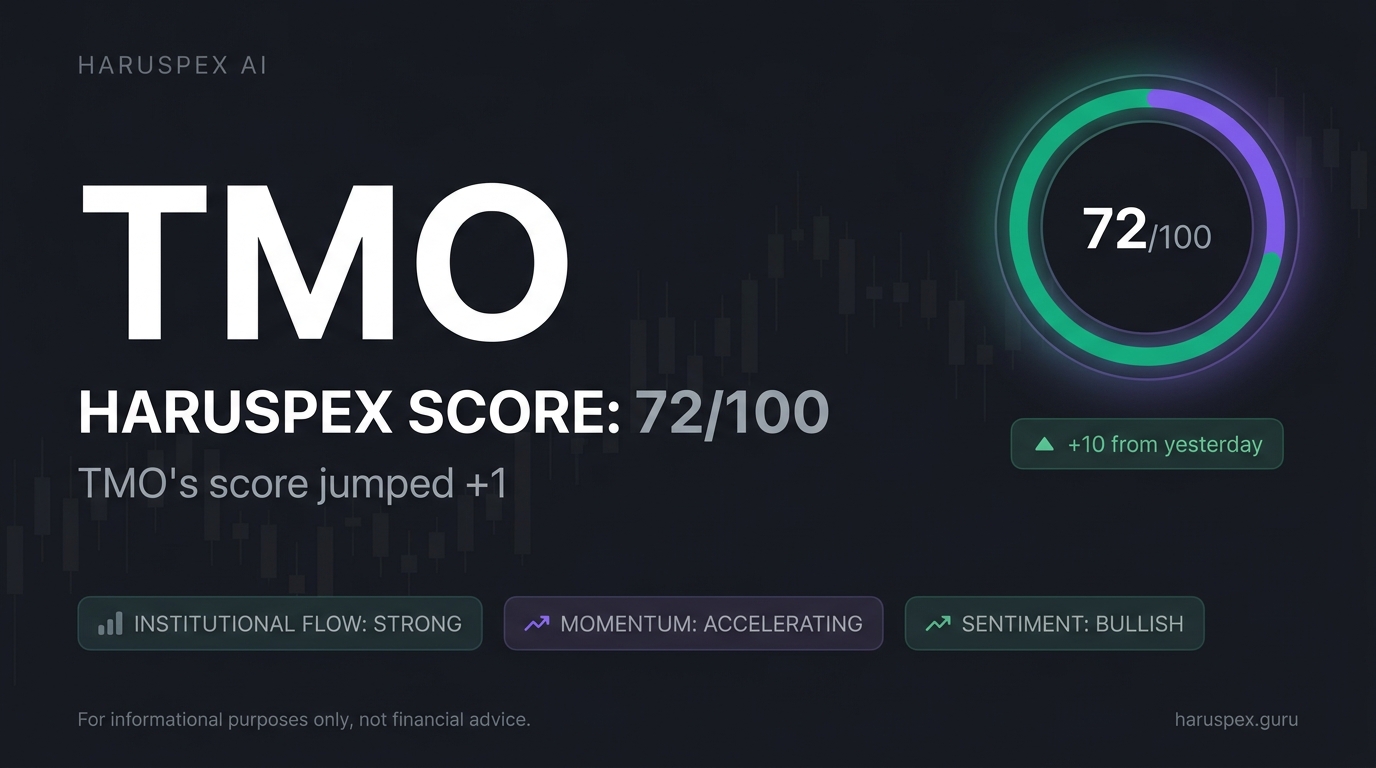
However, sustained WTI Crude Oil prices above $90 per barrel could introduce inflationary pressures that challenge earnings, particularly for margin-sensitive industries. Similarly, any push of the 10Y Treasury Yield decisively above 5.25% might shift capital flows away from equities, reintroducing bearish pressure across broader markets. Companies like DHR, WAT, and TMO, while not leading in these specific dimension movements, often react to shifts in the broader market environment, reflecting overall sentiment.
Risk Factors
While bullish signals are prominent, several dimensions indicate notable bearish pressure. The Insider-Trading dimension, with an average score of 31.9, signals strong bearish pressure, suggesting that company insiders may be divesting shares. This can be a contrarian indicator, often reflecting concerns not yet apparent in broader market data.
Furthermore, the ESG dimension registered an average score of 0.0, indicating very strong bearish pressure. This suggests significant concerns around environmental, social, and governance factors, which could pose long-term risks or reflect poor public perception. Such low scores in these dimensions warrant careful consideration, even amid overall market strength, as they can represent unaddressed systemic issues for specific companies or sectors.
What Would Change This View
- If the S&P 500 consistently closes below 7650 for three consecutive trading days, it would challenge the current bullish directional pressure.
- A significant and sustained drop (e.g., more than 5 points) in the average Regulatory dimension score, reversing its recent gains, would signal a fundamental shift in policy perception.
- Should the 10Y Treasury Yield break above 5.30% and hold that level for a full week, the attractiveness of risk-free assets would increase, potentially drawing capital out of equities and invalidating the current market optimism.
Outlook
The Haruspex data for late September 2026 points to a market exhibiting a measured bullish tilt, with increasing regulatory clarity acting as a key catalyst. Investors should watch for continued strength in institutional flows and positive sentiment as indicators of sustained upward pressure.
However, the pronounced bearish signals from Insider-Trading and ESG dimensions serve as critical reminders of underlying vulnerabilities. Selective positioning, favoring stocks with strong bullish directional signals while hedging against known risk factors, appears prudent in this nuanced market environment.


