
TL;DR: Haruspex data for September 17, 2026, shows the Regulatory dimension emerging as the strongest bullish signal, with an average score of 61.5, up 1.7 points. The S&P 500 gained, reflecting broad positive market pressure. Investors should monitor stocks showing increased regulatory and institutional interest.
Market Overview
On Thursday, September 17, 2026, ET, market analysis from Haruspex indicated an overall bullish tilt, with 55% of the 890 analyzed stocks exhibiting positive directional pressure. The S&P 500 closed at 7,636.68 [data: 2026-09-17 close], marking a 1.12% increase, amidst shifting dynamics detected across various market dimensions. This advance occurred while the VIX measured 15.69 [data: 2026-09-17 close], suggesting moderate volatility.
Macro Regime Monitor
The broader economic landscape presents a mixed picture, with key macro indicators establishing important levels for monitoring.
| Metric | Current | Key Level |
|---|---|---|
| S&P 500 | 7,636.68 | 7,500 (Support) |
| VIX | 15.69 | 20 (Volatility Threshold) |
| 10Y Treasury Yield | 4.94% | 5.00% (Psychological Barrier) |
| WTI Crude Oil | $101.08 | $100 (Inflationary Pressure) |
| US Dollar Index (DXY) | 100.24 | 100 (Neutrality) |
The 10-Year Treasury Yield stood at 4.94% [data: 2026-09-17 close], remaining just below the significant 5.00% mark. WTI Crude Oil prices settled at $101.08 [data: 2026-09-17 close], maintaining pressure above the psychological $100 level. The US Dollar Index (DXY) registered 100.24 [data: 2026-09-17 close], indicating relative strength.
Regime Thresholds
The current market thesis of bullish directional pressure holds as long as the S&P 500 maintains its position above the 7,500 level. Should the VIX consistently trade above 20, it would signal a material shift towards increased market anxiety. Similarly, a sustained breach of the 5.00% threshold by the 10-Year Treasury Yield could alter capital flow dynamics significantly.
What the Data Shows: Key Dimension Trends
Haruspex analysis across 890 stocks highlights shifting market pressures, with several key dimensions signaling clear directional biases. The strongest bullish momentum came from the Regulatory dimension, which saw its average score climb 1.7 points to 61.5. This indicates a growing market anticipation of favorable regulatory environments impacting select sectors and companies. Top stocks influenced include AAPL, MA, and TSLA.
The Institutional dimension also exhibited bullish pressure, holding an average score of 61.4, signaling continued institutional interest. Companies such as MXL, CR, and CRWD were among those showing elevated institutional activity. This sustained interest suggests ongoing confidence from large-scale investors in specific market segments.
Short-Interest and Sentiment dimensions both registered bullish pressure, with average scores of 61.2 and 60.4 respectively. These stable scores suggest either a squeeze potential or a lack of conviction from bearish traders, alongside generally positive investor mood. Notable examples include WF, INTC, and TAK within Short-Interest, and AM, YOU, and INTC for Sentiment.
The Earnings dimension displayed a bullish pressure score of 58.2, reflecting positive expectations around upcoming financial reports or recent strong performance. Companies like ARM, TTMI, and UNFI were among those attracting attention here.
Other dimensions, such as Microstructure, showed an average score of 55.9, with FRO, EW, and GEV noted as top stocks. The Technical dimension, however, remained below average at 48.2, indicating a general lack of strong directional technical signals across the market. Stocks like FRO, SIG, and TXG are among those where technical indicators warrant close observation. The relative weakness in Technicals suggests that while fundamental and regulatory factors are driving some names, broad chart-driven momentum is not universally strong. This presents a nuanced view for investors.
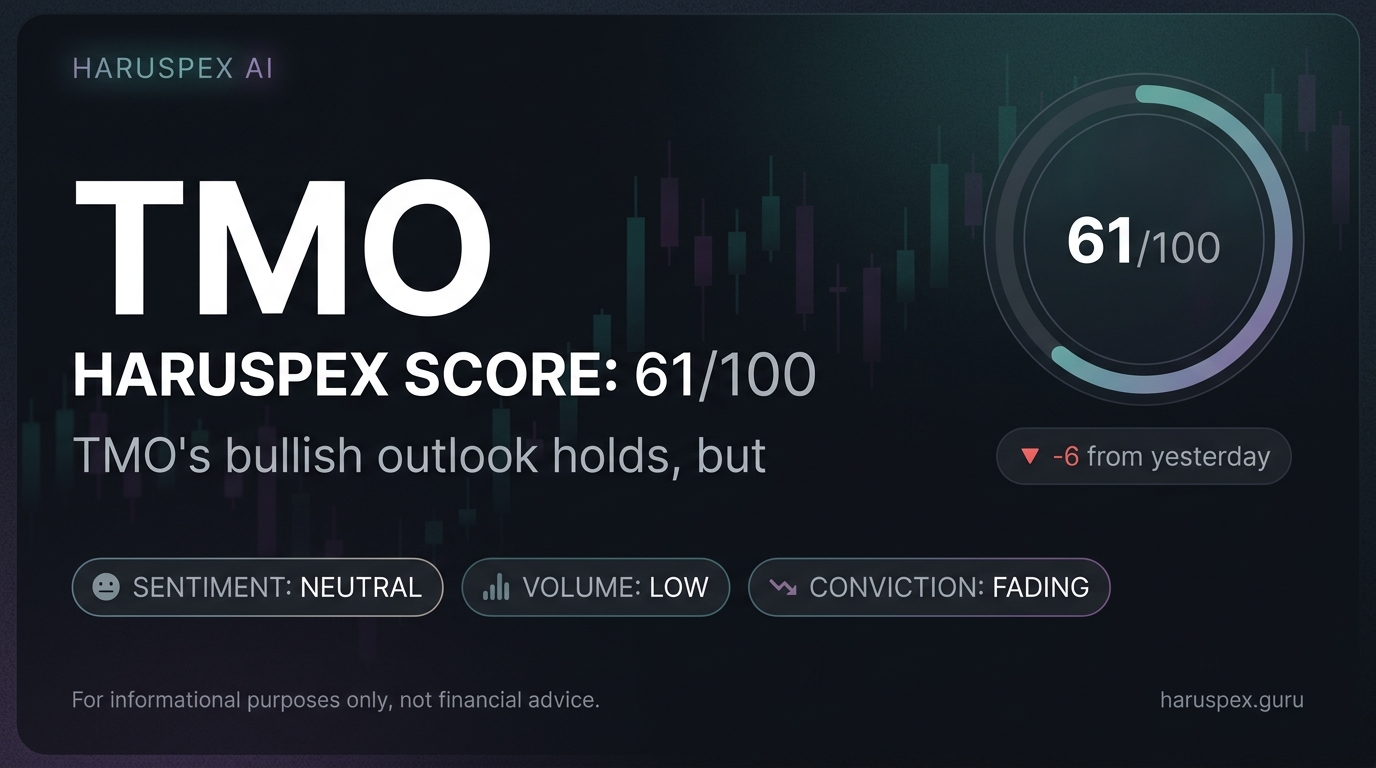
While not top movers in specific dimensions this week, companies like UMC and TMO exist within a broader market showing regulatory tailwinds and institutional focus. Their individual performance will depend on how these overarching pressures intersect with their specific sector dynamics and company-specific news. Investors tracking these names should consider the broader regulatory and institutional trends for potential indirect impacts.
Why do Regulatory tailwinds matter more now?
Rising Regulatory scores indicate that market participants are increasingly pricing in the impact of new or evolving legislation and policy decisions. This dimension captures shifts in the perceived burden or benefit from government actions, which can create significant competitive advantages or disadvantages. Companies adept at navigating or benefiting from these changes, such as those seeing positive signals in AAPL and MA, often experience stronger directional market pressure as a result.
Risk Factors
Despite the prevalent bullish pressure from regulatory and institutional dimensions, several underlying factors present potential headwinds. The Insider-Trading dimension registers a strong bearish pressure score of 33.7, the lowest among all analyzed dimensions. This consistently low score suggests that insiders at various companies, including TSM, AMZN, and JPM, are actively selling shares, which can be a contrarian signal against broader market enthusiasm.
The Technical dimension, at an average of 48.2, shows no significant directional edge market-wide, indicating that price action alone is not consistently confirming the strength seen in other dimensions. This divergence between fundamental-driven signals and technical indicators could suggest a market prone to quick reversals or that gains are concentrated in specific sectors.
The sustained high price of WTI Crude Oil above $100 could also pose a risk. Energy cost inflation may pressure margins for manufacturing and transportation-intensive sectors, potentially dampening future earnings outlooks despite positive regulatory shifts elsewhere.
What Would Change This View
The current thesis of bullish directional pressure, predominantly driven by regulatory and institutional factors, would face invalidation under specific conditions. First, a sustained drop in the average Regulatory dimension score below 55 for two consecutive reporting periods would signal a reversal in this key tailwind. Second, if the S&P 500 closes below its 50-day moving average on two consecutive trading days, it would indicate a loss of broad market support.
Finally, a significant and sustained increase in the VIX above 20, coupled with an acceleration of bearish pressure in the Insider-Trading dimension (e.g., average score falling below 30), would collectively suggest a fundamental shift in market sentiment and underlying conditions.
Outlook
The immediate outlook suggests that market participants will continue to reward companies perceived to be aligning favorably with regulatory changes and strong institutional backing. The elevated bullish pressure in the Regulatory and Institutional dimensions points to a period where fundamental shifts and smart money flows are critical drivers of stock performance.
Investors should remain watchful of potential divergences, particularly the bearish signals from insider selling and the neutral stance of technical indicators. Focus on companies with robust alignment with regulatory trends and strong institutional support, while exercising caution with names exhibiting weak technicals or significant insider selling.
Disclaimer: This article is for informational purposes only and does not constitute investment advice. All investment decisions should be made with the assistance of a professional financial advisor. Haruspex scores represent detected market directional pressure, not company quality ratings.


