
TL;DR: Haruspex data for August 17, 2026, detected 248 bullish signals across 330 stocks, indicating broad positive directional market pressure. ConocoPhillips (COP) showed strong bullish signals driven by microstructure, while Broadcom (AVGO) experienced a notable price drop despite underlying bullish indicators. Investors should monitor key support levels and specific dimension shifts.
On Monday, August 17, 2026 ET, the broader market experienced a slight pullback, with the S&P 500 closing down 0.17% at 7785.76 [data: 2026-08-17 close]. Despite this minor decline, Haruspex analysis revealed a strong underlying bullish market sentiment across a substantial portion of monitored equities. Out of 330 analyzed stocks, 248 registered bullish directional signals, significantly outweighing the 3 bearish and 79 neutral readings.
Macro Regime Monitor
The current macro environment presents a mixed picture. While the S&P 500 saw a marginal dip, the Volatility Index (VIX) remained subdued at 15.06 [data: 2026-08-17 close]. This suggests that while there was a slight market decline, it was not accompanied by significant fear or uncertainty, aligning with the dominant bullish sentiment detected by Haruspex.
Rising interest rates continue to be a factor, with the 10-Year Treasury Yield at 4.71% [data: 2026-08-17 close]. This level influences borrowing costs and valuation models across sectors. Crude oil prices remained elevated, with WTI Crude Oil at $83.05 [data: 2026-08-17 close], impacting energy sector dynamics and broader inflationary pressures.
The US Dollar Index (DXY) stood at 99.46 [data: 2026-08-17 close], which can affect multinational corporate earnings and commodity prices. These macro factors create a complex backdrop for individual stock movements, demanding detailed analysis beyond headline indices.
| Metric | Current | Key Level |
|---|---|---|
| S&P 500 | 7785.76 (-0.17%) [data: 2026-08-17 close] | 7800 (Resistance) |
| VIX | 15.06 [data: 2026-08-17 close] | 20 (Volatility Threshold) |
| 10Y Treasury Yield | 4.71% [data: 2026-08-17 close] | 4.50% (Support) |
| WTI Crude Oil | $83.05 [data: 2026-08-17 close] | $80 (Cost Baseline) |
| US Dollar Index (DXY) | 99.46 [data: 2026-08-17 close] | 100 (Psychological Resistance) |
What Haruspex Detected
Haruspex analysis leverages various dimensions to identify market directional pressure that single-factor screens often miss. Today's broad bullish trend, encompassing 248 stocks, highlights distinct underlying factors supporting specific equities. This nuanced approach helps to filter noise from the daily market fluctuations.
For example, while the overall market saw a minor retreat, specific stocks exhibited strong bullish signals across their microstructure, institutional ownership, and competitive intelligence dimensions. These factors suggest market participants are positioning for further gains, despite the intraday softness of the broader index.
The concentration of bullish signals in particular dimensions offers a more granular understanding of market conviction. This provides a clearer picture than simply observing aggregate price movements or general market sentiment indicators.
Why did Broadcom fall despite bullish signals?
Despite a strong bullish directional signal of 71.0 from Haruspex analysis, AVGO (Broadcom Inc.) declined 5.94% to $392.99 [data: 2026-08-17 close]. This score was primarily driven by robust institutional ownership intelligence, which registered 71. This indicated AVGO has 80.4% institutional ownership across 6,270 institutions, with net institutional buying detected. Strong institutional accumulation can support prices over time.
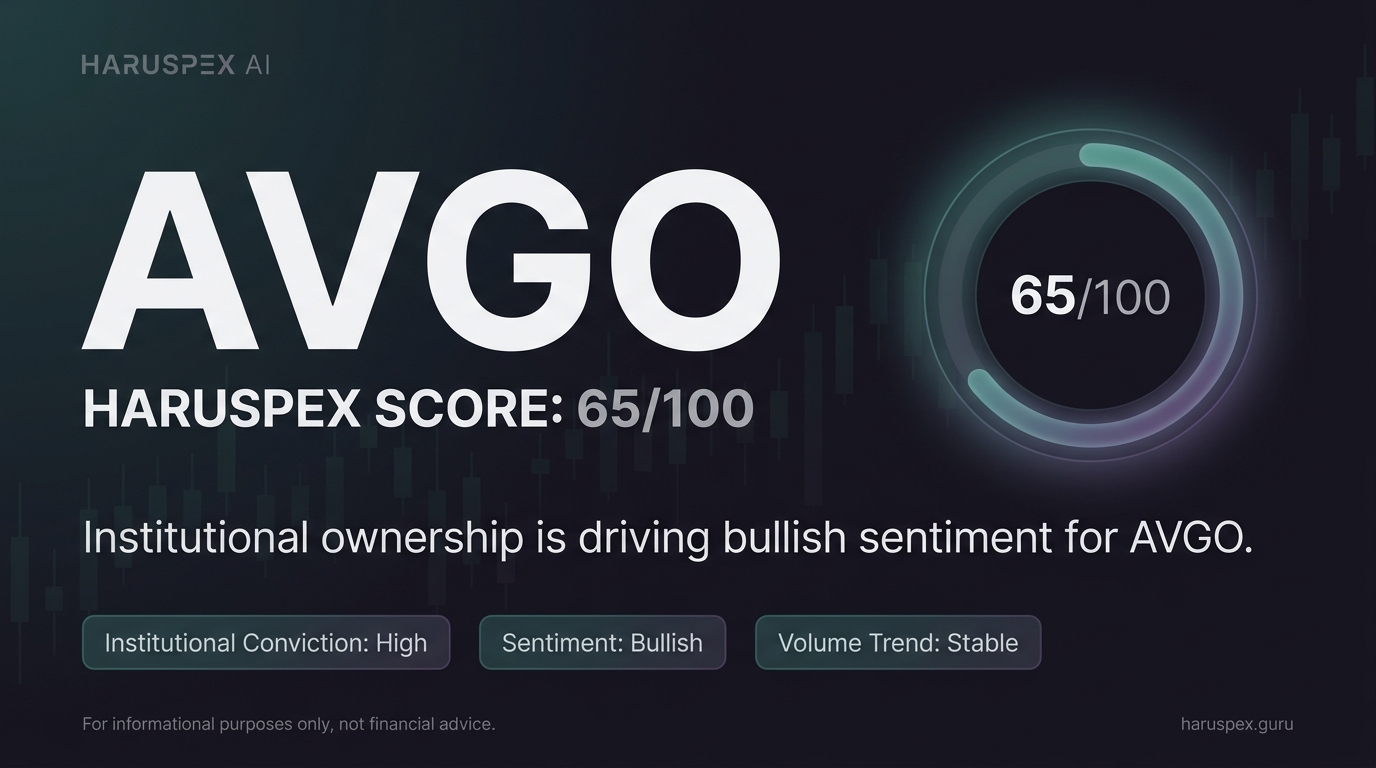
The current market pressure detected for AVGO was also supported by a sentiment score of 67 and a short-interest score of 65. The divergence between the detected bullish pressure and the intraday price action highlights that while underlying market positioning might be favorable, short-term selling pressure or news events can still cause significant price moves.
Investors should observe if this institutional accumulation continues to provide a floor for AVGO in subsequent trading sessions. Short-term volatility can occur even in the presence of strong long-term directional signals. Monitoring future volume and order flow will be key for confirmation.
Top Stocks Under Analysis
ConocoPhillips (COP): Strong Microstructure Signals
COP (ConocoPhillips) registered a strong bullish directional signal of 73.0, closing up 1.81% at $126.78 [data: 2026-08-17 close]. This positive pressure was largely driven by its microstructure dimension, which scored 70. Haruspex analysis indicated balanced order flow and excellent liquidity with tight spreads for COP, suggesting efficient trading dynamics.
Further bullish pressure came from its earnings dimension at 68 and options-flow at 66. These signals collectively point to a market anticipating continued strength for COP. The stock's current price sits comfortably within its 52-week range of $85.57-$135.87, reinforcing the positive outlook.
To confirm this directional signal, traders should monitor volume and order flow closely. Sustained positive order flow can further strengthen the detected bullish pressure for COP, indicating continued market interest in the energy giant.
Visa Inc. (V): Competitive Edge Sustains Bullish Pressure
V (Visa Inc.) showed a bullish directional signal of 67.0, even with a slight dip of 0.36% to $364.15 [data: 2026-08-17 close]. The primary driver for this bullish pressure was its competitors dimension, which scored 70. Visa Inc. ranks first by market capitalization among its four industry peers in the Credit Services sector.
The analysis also detected strong profitability exceeding industry peers, contributing to the competitive intelligence score. Regulatory (65) and institutional (63) dimensions further supported the overall bullish pressure for V. These factors highlight Visa's strong market position and operational effectiveness.
Investors should watch for follow-through in competitive intelligence signals, as continued outperformance against peers can sustain this bullish pressure. The stock trades near the top of its 52-week range of $293.89-$373.97, suggesting market confidence.
AbbVie Inc. (ABBV): Bullish Sentiment and Short-Interest
ABBV (AbbVie Inc.) registered a strong bullish directional signal of 71.0, despite a 0.54% decline to $249.46 [data: 2026-08-17 close]. The key drivers were its sentiment dimension at 69 and short-interest dimension at 65. The sentiment score reflects positive algorithmic market sentiment toward ABBV.
A higher short-interest score often suggests less short selling pressure or potential for short covering, which can provide an upward bias. The earnings dimension also contributed bullish pressure with a score of 63. These combined factors indicate market participants see upside potential for ABBV.
While the intraday price action was negative, the underlying directional signals suggest that market participants maintain a bullish outlook. ABBV is trading within its 52-week range of $190.75-$267.47, reflecting previous market movements.
Apple Inc. (AAPL): Institutional and Regulatory Support
AAPL (Apple Inc.) maintained a bullish directional signal of 64.0, closing up 0.22% at $305.93 [data: 2026-08-17 close]. This signal was primarily supported by its institutional ownership dimension, which scored 69, indicating significant institutional interest. The regulatory dimension also contributed bullish pressure with a score of 65.
The earnings dimension also provided a bullish signal at 64. These specific dimensions highlight persistent underlying support for AAPL. Despite its large market capitalization, institutional activity and regulatory environment continue to exert positive directional pressure on the stock.
Future price action for AAPL will depend on sustained institutional buying and continued positive regulatory developments. The current price is well within its 52-week range of $223.78-$344.57, suggesting room for movement based on these underlying factors.
Other Notable Bullish Signals
Haruspex also detected bullish pressure for several other significant companies. LLY (Eli Lilly and Company) scored 66.0, driven by a strong competitive intelligence dimension (71), indicating its leadership in the Drug Manufacturers - General industry. This competitive edge provides a clear directional signal.
TFC (Truist Financial Corporation) also registered a strong bullish signal of 70.0. This was supported by robust institutional ownership (70) and microstructure (70) dimensions, reflecting significant institutional interest and efficient order flow. These factors often precede sustained price strength.
EC (Ecopetrol S.A.) and E (Eni S.p.A.) both received bullish signals of 70.0, largely due to strong microstructure dimensions (67 and 69, respectively). Balanced order flow and excellent liquidity are contributing to positive directional pressure for these energy sector names.
Risk Factors
The market's bullish directional signals are subject to several risks. An unexpected spike in the VIX above 20 [data: 2026-08-17 close] could signal increased volatility and potentially reverse positive sentiment. Geopolitical events or significant economic data releases could also disrupt current trends, leading to sharp market reactions.
Persistent inflation beyond current expectations could force central banks to adopt more aggressive tightening policies, impacting corporate earnings and investor risk appetite. This scenario could quickly change the dynamics for interest-rate sensitive sectors and growth stocks, regardless of individual stock signals.
Commodity price volatility, particularly for WTI Crude Oil, presents a risk to companies with high energy input costs. While some energy stocks benefit, other sectors could face margin compression, altering their market directional pressure. Monitoring these macro indicators remains crucial.
What Would Change This View
The current bullish market view would be challenged if the S&P 500 closes below 7600 for two consecutive trading days on elevated volume. Such a move would suggest a breakdown of recent support levels and a potential shift in broader market sentiment away from its current bullish posture.
A sustained increase in the 10-Year Treasury Yield above 4.85% [data: 2026-08-17 close] could trigger a repricing of equities, particularly growth stocks, as higher discount rates impact future earnings valuations. This would invalidate bullish signals for rate-sensitive sectors.
For individual stocks like COP or V, a significant and sustained deterioration in their key driving dimensions—such as a drop in microstructure scores below 50 for COP or competitive intelligence scores below 55 for V—would necessitate a re-evaluation of their respective bullish directional pressures.
Market Outlook
Haruspex analysis for Monday, August 17, 2026, reveals a robust underlying bullish market pressure, with 248 out of 330 stocks showing positive directional signals. While the S&P 500 experienced a minor pullback, the subdued VIX and concentrated bullish signals in specific equity dimensions suggest resilience.
The forward outlook remains cautiously optimistic, predicated on continued institutional support, favorable competitive positioning, and stable market microstructure for leading stocks. Investors should monitor macro indicators for any shifts, especially in interest rates and commodity prices, which could influence sector-specific dynamics.
The strength in dimensions like institutional ownership, competitive intelligence, and microstructure points to specific areas of market conviction. This detailed view allows investors to identify where true directional pressure resides, even as headline indices exhibit mixed short-term movements.


