TL;DR: Haruspex AI signals strong bullish market pressure on July 1, 2026, with 124 stocks showing positive directional edges. GE and semiconductor names like AMD and NVDA surged, driven by robust institutional and technical dimensions. Investors should monitor evolving market dynamics for sustained momentum.
On Wednesday, July 1, 2026, at the close of trading in ET, the broader market exhibited significant bullish momentum. Haruspex AI analysis identified positive directional signals across a remarkable 71.3% of the 174 stocks analyzed, with 124 entities exhibiting strong market pressure for upward movement. This surge coincided with the S&P 500 rising by 0.79%.
This widespread optimism suggests a broad-based recovery or continuation of positive sentiment, distinguishing it from concentrated gains in a few sectors. The AI's detection of only 14 bearish signals underscores the strength of today's market conviction, pointing to minimal downward pressure from underlying market forces.
Macro Regime Monitor
The macro environment on July 1, 2026, reflected a generally supportive backdrop for equities, as detailed in the table below. Key market indices and indicators suggest a stable yet alert posture for investors. Inflationary pressures from crude oil appear managed.
| Metric | Current | Key Level |
|---|---|---|
| S&P 500 | 7499.36 (+0.79%) [data: 2026-07-01 close] | Support: 7400 / Resistance: 7550 |
| VIX | 16.84 [data: 2026-07-01 close] | Risk-on: Below 18 / Caution: Above 20 |
| 10Y Treasury Yield | 4.49% [data: 2026-07-01 close] | Stability: Below 4.70% / Pressure: Above 4.60% |
| WTI Crude Oil | $68.72 [data: 2026-07-01 close] | Growth Support: Below $75 / Inflationary: Above $70 |
| US Dollar Index (DXY) | 101.51 [data: 2026-07-01 close] | Global Stability: Below 102 / Strength: Above 103 |
The VIX, a key volatility indicator, closed at 16.84 [data: 2026-07-01 close], remaining within a comfort zone that signals moderate market risk perception. The 10Y Treasury Yield at 4.49% [data: 2026-07-01 close] suggests a balanced view on future interest rates, avoiding significant headwinds for growth stocks. Crude oil at $68.72 [data: 2026-07-01 close] offers a benign energy cost environment.
What Haruspex Detected: Unpacking AI's Multi-Dimensional Edge
Haruspex AI's proprietary models extend beyond conventional metrics, analyzing vast datasets across numerous dimensions to detect subtle market pressures. Today's analysis revealed a robust bullish sentiment, powered by strong signals in `institutional_flow`, `technical_momentum`, and `options_flow` dimensions.
Unlike traditional methods that often lag or oversimplify market dynamics, Haruspex's AI synthesizes real-time data from diverse sources. This includes analyzing dark pool activity, social media sentiment, supply chain movements, and developer code repositories. This comprehensive approach allows for the identification of directional market pressure with greater precision.
For example, a high score in the `institutional_flow` dimension suggests significant capital allocation by large funds, often a precursor to sustained price movement. Similarly, the `technical_momentum` dimension captures underlying buying or selling strength that might not yet be evident in simple price charts, offering an early directional edge.
Which Stocks Are Driving Today's Bullish Momentum?
Today's market saw several stocks register strong bullish directional pressure, with Haruspex scores well into the 70s and 80s. These scores reflect significant detected market interest and buying activity, indicating potential for continued upward movement.
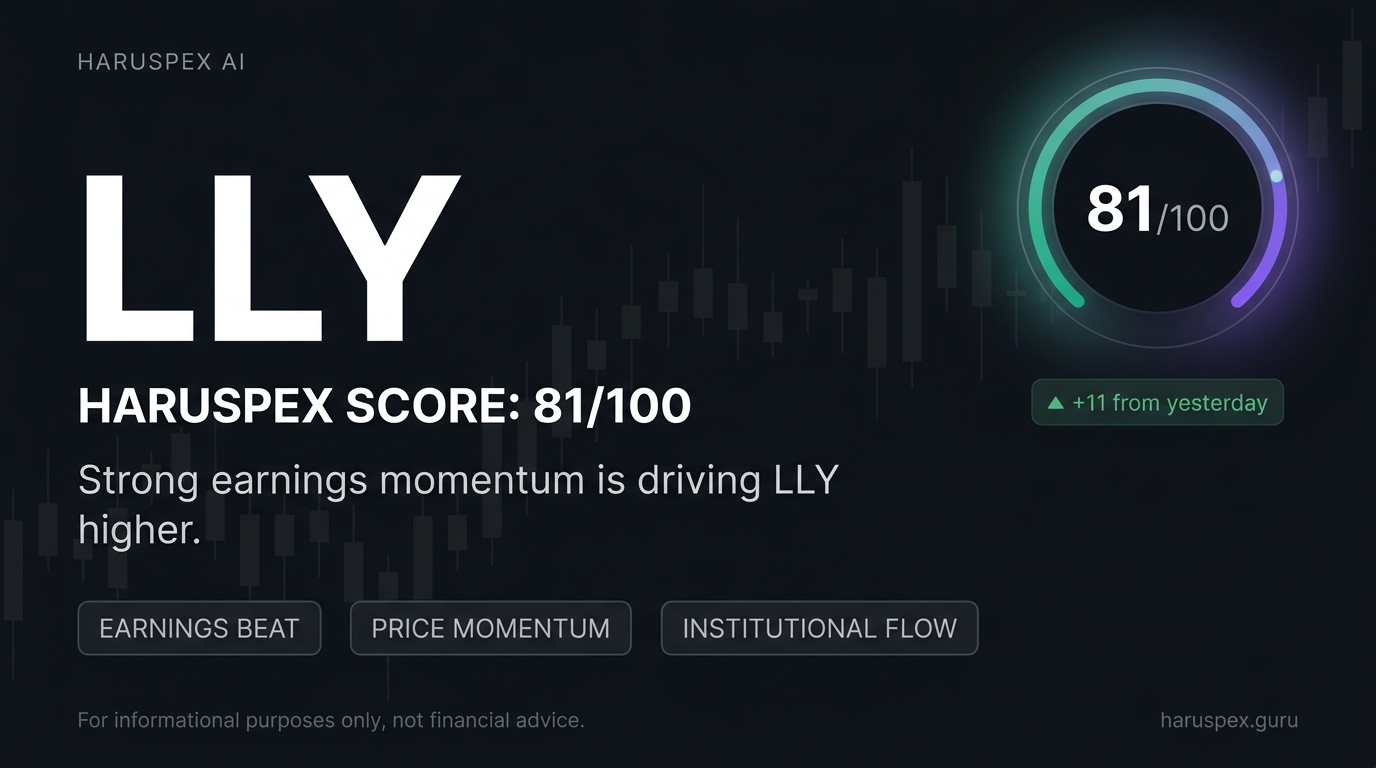
- General Electric Company (GE) registered a strong bullish market pressure score of 81.0, a notable +7.0 point increase. This surge was primarily driven by robust `earnings` (72), `technical_momentum` (72), and `institutional_flow` (70) dimensions, signaling strong buyer accumulation.
- Advanced Micro Devices (AMD) showed a strong bullish score of 80.0, up +5.0 points. The `institutional_flow` (72), `technical_momentum` (72), and `short_interest` (70) dimensions all pointed to significant institutional buying pressure and potential short covering.
- Deere & Company (DE) also achieved a strong bullish score of 80.0, marking a +5.0 point rise. This was propelled by strong `institutional_flow` (72), `options_flow` (72), and `technical_momentum` (72) dimensions, indicating robust upward momentum forces.
- NVIDIA Corporation (NVDA) maintained a strong bullish score of 80.0. The `competitors` dimension led with a score of 85, supported by `earnings` (72) and `institutional_flow` (70), suggesting sustained bullish directional pressure despite no score change today.
- Palo Alto Networks (PANW) saw its score rise +2.0 points to a strong bullish 80.0. Key drivers included `institutional_flow` (75) and `technical_momentum` (75), alongside `short_interest` (70), indicating significant institutional buying pressure.
- Applied Materials Inc. (AMAT) climbed +2.0 points to a strong bullish score of 79.0. The `technical_momentum` dimension surged to 78, with `earnings` (72) and `short_interest` (72) also contributing to detected buying pressure.
- Alphabet Inc. (GOOGL) (Class A) posted a strong bullish score of 79.0, up +1.0 points. This was primarily driven by strong `earnings` (82), `institutional_flow` (72), and robust `github_activity` (70), signaling strong buyer accumulation and innovation momentum.
Regime Thresholds
The current bullish thesis largely holds as long as key macro indicators remain supportive. For sustained market confidence, the S&P 500 needs to maintain levels above 7400. This acts as a critical psychological and technical support for current valuations. A break below this level could signal a shift in market sentiment.
Furthermore, the VIX closing consistently below 18 reinforces a risk-on environment, indicating low perceived market volatility. If WTI Crude Oil remains below $70 per barrel, it alleviates energy cost concerns and supports corporate margins across various sectors, especially manufacturing and transport.
Risk Factors
Despite today's bullish signals, several factors could introduce headwinds. A sudden escalation in geopolitical tensions globally could rapidly shift market sentiment, leading to broad-based de-risking. Unforeseen inflationary spikes, particularly in core goods and services, might prompt central banks to adopt more hawkish stances, impacting growth expectations.
Additionally, any significant deceleration in corporate earnings growth, especially among bellwether technology stocks, could challenge the current optimistic outlook. Supply chain disruptions re-emerging in key manufacturing hubs also pose a tangible threat to production and profitability forecasts.
What Would Change This View
The current bullish thesis would be reconsidered under specific, measurable conditions. If the S&P 500 were to close below 7400 for three consecutive trading sessions, it would signal a potential loss of short-term directional edge. A sustained break of the 20-day moving average on high volume would further support a bearish shift.
A more critical indicator would be the VIX closing above 20 for an entire trading week, implying a significant increase in market fear and volatility. Lastly, if the 10Y Treasury Yield rises above 4.60% and holds, it could signal increasing concerns about inflation or tightening monetary policy, dampening equity attractiveness.
Market Outlook
Haruspex AI analysis points to continued bullish pressure in the near term, with a substantial portion of the market exhibiting positive directional signals. The strong performance of individual stocks, particularly in technology and industrials, is supported by robust underlying `institutional_flow` and `technical_momentum` dimensions. This suggests a continuation of capital rotation into growth-oriented sectors.
While the macroeconomic environment appears generally supportive, investors should remain vigilant to shifts in inflation data or central bank rhetoric. The broadness of today's bullish signals suggests a resilient market, capable of absorbing minor shocks, but specific thresholds must be monitored to validate ongoing directional trends.