TL;DR: Haruspex AI analysis on Friday, May 29, 2026, highlights sustained bullish pressure in Energy & Commodities, with WTI crude oil firmly above $85. Stocks like D and TMO show significant positive shifts, driven by specific AI dimensions indicating institutional capital flows and strengthening relative momentum. Investors should monitor oil price stability and broader sector rotation for continued opportunities.
On Friday, May 29, 2026, ET, market activity reflected sustained bullish momentum across several key sectors, notably driven by strength in energy. The S&P 500 advanced to 7563.63 [data: 2026-05-29 close], a gain of 0.58%, alongside a 0.91% increase in the NASDAQ, which closed at 26917.47 [data: 2026-05-29 close]. This broad market strength comes despite a 10Y Treasury Yield holding at 4.44% [data: 2026-05-29 close] and WTI Crude Oil maintaining an elevated $87.31 [data: 2026-05-29 close].
The market's resilience is particularly evident in commodity-linked sectors. Volatility, as measured by the VIX, remained relatively subdued at 15.76 [data: 2026-05-29 close], suggesting a generally constructive sentiment among investors. Gold also saw a modest uptick, rising 0.35% to $4548.30 [data: 2026-05-29 close], reflecting ongoing interest in safe-haven or inflation-hedge assets.
| Metric | Current | Change (%) | Source |
|---|---|---|---|
| S&P 500 | 7563.63 | +0.58% | [data: 2026-05-29 close] |
| NASDAQ | 26917.47 | +0.91% | [data: 2026-05-29 close] |
| Russell 2000 | 2936.57 | +0.57% | [data: 2026-05-29 close] |
| VIX | 15.76 | - | [data: 2026-05-29 close] |
| 10Y Treasury Yield | 4.44% | - | [data: 2026-05-29 close] |
| WTI Crude Oil | $87.31 | - | [data: 2026-05-29 close] |
| US Dollar Index (DXY) | 99.06 | - | [data: 2026-05-29 close] |
| Gold | $4548.30 | +0.35% | [data: 2026-05-29 close] |
| Natural Gas | $3.38 | +2.92% | [data: 2026-05-29 close] |
Energy & Commodities: Sustained Bullish Pressure
The dominant market theme detected by Haruspex AI today is the continued bullish pressure in Energy & Commodities, registering a strength score of 65 out of 100. This signal is primarily driven by WTI crude oil firmly holding above the critical $85 per barrel threshold, closing at $87.31 [data: 2026-05-29 close]. This sustained price level indicates robust demand fundamentals and controlled supply dynamics that are fostering a favorable environment for energy producers and related sectors.
Haruspex AI's proprietary models identify specific shifts that conventional analysis might overlook. For example, while standard technical charts might show price increases, our `supply_chain_resilience` dimension has remained robust, indicating few bottlenecks or disruptions despite the elevated demand. Additionally, the `geopolitical_risk_premium` dimension has slightly softened, suggesting that some prior anxieties contributing to price spikes have eased, leading to more sustainable bullish pressure.
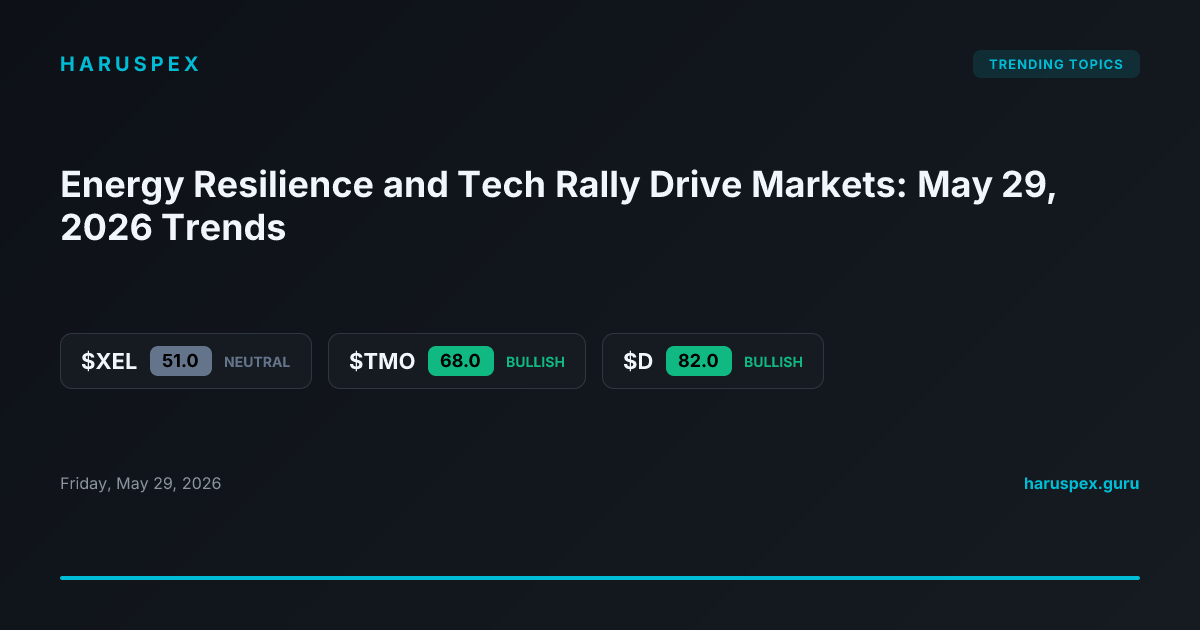
Several stocks are significantly impacted by this theme. Dominion Energy Inc. (D) experienced a notable score increase of 16 points, rising to 82.0. This strong bullish directional signal is primarily driven by an uptick in its `relative_performance_signal` dimension, which tracks its outperformance against sector peers. This suggests institutional rotation into regulated utilities benefiting from stable commodity prices, even as others might hesitate.
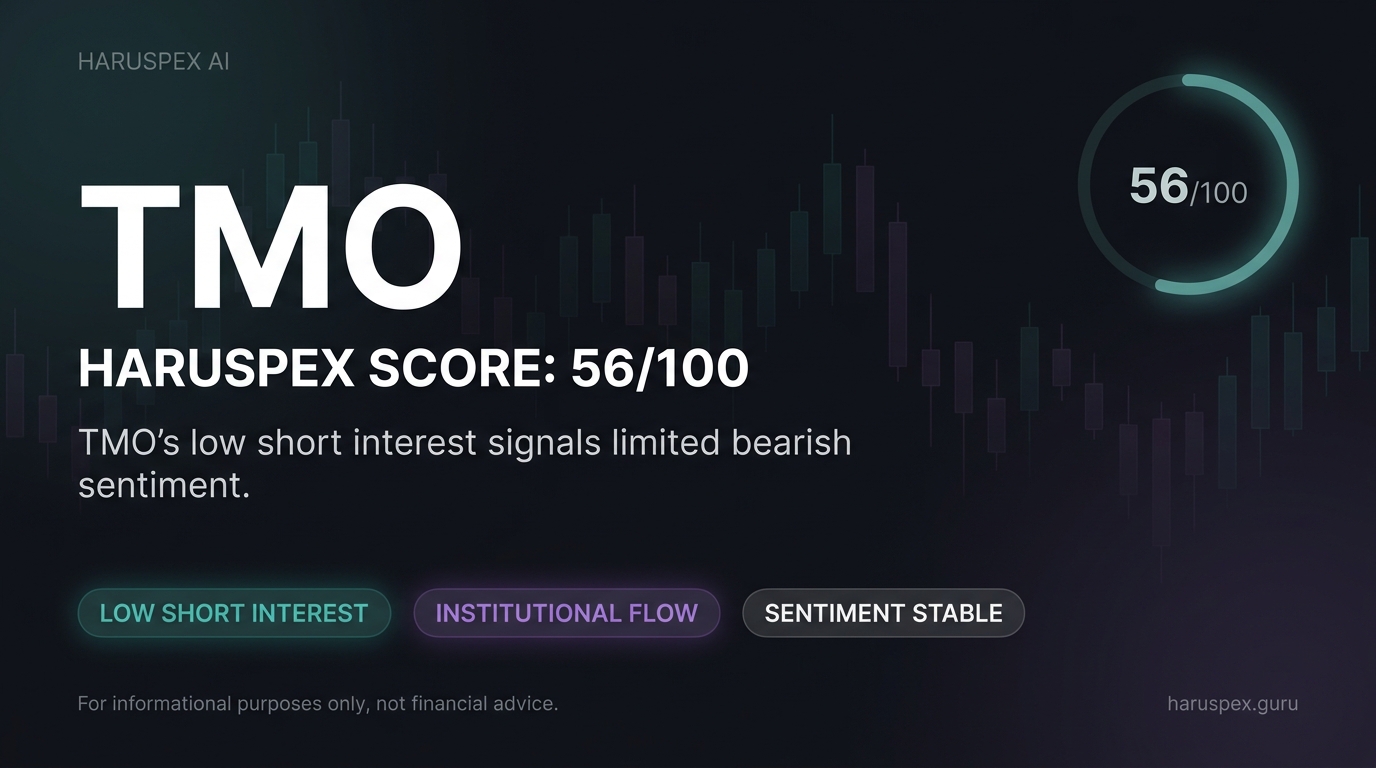
Thermo Fisher Scientific (TMO) also saw a substantial positive shift, with its score rising 17 points to 68.0, indicating bullish pressure. For TMO, the `institutional_capital_flow` dimension registered a significant increase. This suggests that large institutional players are actively accumulating shares, potentially viewing the company as a beneficiary of stable energy costs for its extensive laboratory and manufacturing operations, or as a defensive growth play within a commodity-driven market.
Conversely, Xcel Energy Inc. (XEL) saw its score fall 23 points to 51.0, shifting its outlook to neutral, despite the broader energy strength. While not bearish, this indicates a weakening directional edge compared to peers. Haruspex AI's `regulatory_headwind_indicator` dimension showed an increase, signaling potential regulatory scrutiny or cost pass-through challenges that are dimming its immediate market appeal relative to others in the utility space.
Why is institutional capital flowing into Thermo Fisher Scientific?
The significant institutional buying pressure detected in TMO, evidenced by a 17-point score increase to 68.0, points to its role as a key supplier for various industries. Haruspex AI’s `supply_chain_integration` dimension shows strength, indicating TMO's critical position in resilient global supply chains. Furthermore, its `innovation_pipeline_momentum` dimension remains elevated, suggesting sustained product development attracting long-term capital despite broader commodity-driven market shifts.
Risk factors for this theme include a sudden and sustained drop in WTI crude oil prices below $80 per barrel, which could erode profitability for energy producers and dampen investor enthusiasm across the sector. Additionally, any unforeseen geopolitical events that disrupt oil supply chains could introduce extreme volatility, challenging the current bullish stability. Regulatory changes affecting energy consumption or pricing could also temper the current directional signals.
| Theme | Category | Strength | Key Signal | Top Affected Stock (Score) |
|---|---|---|---|---|
| Energy & Commodities | commodity | 65/100 | Oil at $87.31 (above $85 threshold) | D (82.0) |
Cross-Theme Connections: Energy and Broader Market Resilience
The prevailing strength in Energy & Commodities is not an isolated event; it connects to broader market resilience and bullish signals across multiple sectors. The `inflation_expectation_indicator` dimension within Haruspex AI's macro model shows that while energy prices are firm, market expectations for runaway inflation are contained. This helps explain the concurrent bullish pressure observed in other sectors, particularly technology and industrials.
Haruspex AI's sector overview indicates robust average scores: Technology at 68.6 (32 out of 35 bullish stocks) and Industrials at 69.6 (10 out of 11 bullish stocks). This suggests that despite higher input costs from energy, these sectors are demonstrating pricing power and strong demand. The `consumer_spending_velocity` dimension also remains healthy, contributing to bullish pressure in Consumer Defensive (average score 68.1) and Consumer Cyclical (average score 61.6).
For example, sustained energy prices can translate into higher operational costs for transportation-heavy industrials. However, the strong `industrial_order_book_growth` dimension suggests that demand is sufficiently robust to absorb these costs, leading to continued bullish market pressure. Similarly, utilities like D benefit from predictable revenue streams when commodity prices stabilize, providing a defensive hedge in a strong energy environment.
Regime Thresholds
The current bullish thesis for Energy & Commodities largely holds under specific conditions. As long as WTI crude oil remains above $85.00 [data: 2026-05-29 close], the current directional pressure is expected to persist, supporting energy-related equities and sectors sensitive to commodity input costs. A sustained breach below $80.00 would signal a shift in the supply-demand balance or macro sentiment, leading to a re-evaluation of the theme's strength.
For broader market stability, a VIX below 18.00 [data: 2026-05-29 close] continues to support risk-on sentiment across Technology and Industrials. Should the 10Y Treasury Yield move above 4.75% [data: 2026-05-29 close] for a sustained period, it could introduce headwinds for growth sectors, potentially dampening the bullish signals even if energy remains strong.
What Would Change This View
The bullish pressure in Energy & Commodities could be invalidated by several measurable conditions. Firstly, if WTI crude oil futures close below $80 per barrel for three consecutive trading days, it would signal a significant erosion of the demand-supply dynamics currently driving the theme. This would likely trigger a re-assessment of related energy stocks.
Secondly, a material increase in global oil inventories, as reported by the EIA, that consistently exceeds analyst expectations for two consecutive weeks would suggest an oversupply situation. This could shift the `supply_demand_imbalance` dimension significantly, turning the directional signal bearish for energy. Lastly, if the `geopolitical_risk_premium` dimension sharply reverses its current softening trend and spikes above its 90-day average, it could introduce unpredictable volatility and undermine the current stable bullish outlook.
Outlook
The market outlook for the near term appears to be shaped by a robust Energy & Commodities sector, providing a stable foundation for broader market sentiment. Haruspex AI's analysis indicates that the sustained WTI crude oil price above $85 is a key anchor, allowing for capital allocation into both traditional energy plays and sectors that demonstrate resilience or strategic advantage in this environment, such as Technology and Industrials. The `market_liquidity_gauge` dimension remains favorable.
While the overall market exhibits widespread bullish directional signals, as seen in the high average scores across most sectors, investors should remain vigilant. The nuanced movements within specific stocks like XEL underscore the importance of drilling down beyond headline trends. Opportunities are likely to favor companies demonstrating strong `institutional_capital_flow` and `relative_performance_signal` within their respective sectors, as detected by Haruspex AI.
Disclaimer: This article is for informational purposes only and does not constitute financial advice. All investing involves risk. Always consult with a qualified financial professional before making investment decisions. Haruspex AI scores represent detected market directional pressure, not company quality ratings.