
TL;DR: Haruspex AI analysis on June 2, 2026, reveals a market under broad bullish pressure, with the Macro dimension surging an impressive +5.7 points. This suggests external economic tailwinds are strengthening. Investors should watch for continued momentum in sectors sensitive to these macro shifts.
On Tuesday, June 2, 2026, at market close ET, Haruspex AI detected a prevailing bullish market sentiment across 221 analyzed stocks. The market-wide average AI score climbed to 62.0 out of 100, with 70% of companies exhibiting bullish pressure signals. This broad optimism is largely driven by a significant shift in macro-level indicators.
Macro Regime Monitor
The broader economic environment continues to shape market sentiment. Key macro indicators held steady or showed slight positive movement, providing a generally supportive backdrop for equity markets.
| Metric | Current | Key Level |
|---|---|---|
| S&P 500 | 7,613.51 (+0.18%) [data: 2026-06-02 close] | Above 7,500 signals strength |
| VIX | 16.06 [data: 2026-06-02 close] | Below 18 indicates low volatility |
| 10Y Treasury Yield | 4.45% [data: 2026-06-02 close] | Below 4.5% generally supportive |
| WTI Crude Oil | $92.67 [data: 2026-06-02 close] | Above $90 can pressure margins |
| US Dollar Index (DXY) | 99.14 [data: 2026-06-02 close] | Below 100 suggests export advantage |
What the AI Sees: Surging Macro Momentum
The most compelling data insight from Haruspex's AI analysis is the substantial increase in the macro_pressure dimension. This dimension saw a remarkable +5.7 point change, settling at an average score of 62.0. This indicates a strong positive directional signal from market-wide economic forces influencing various sectors.
Why is the Macro dimension signaling strong bullish pressure?
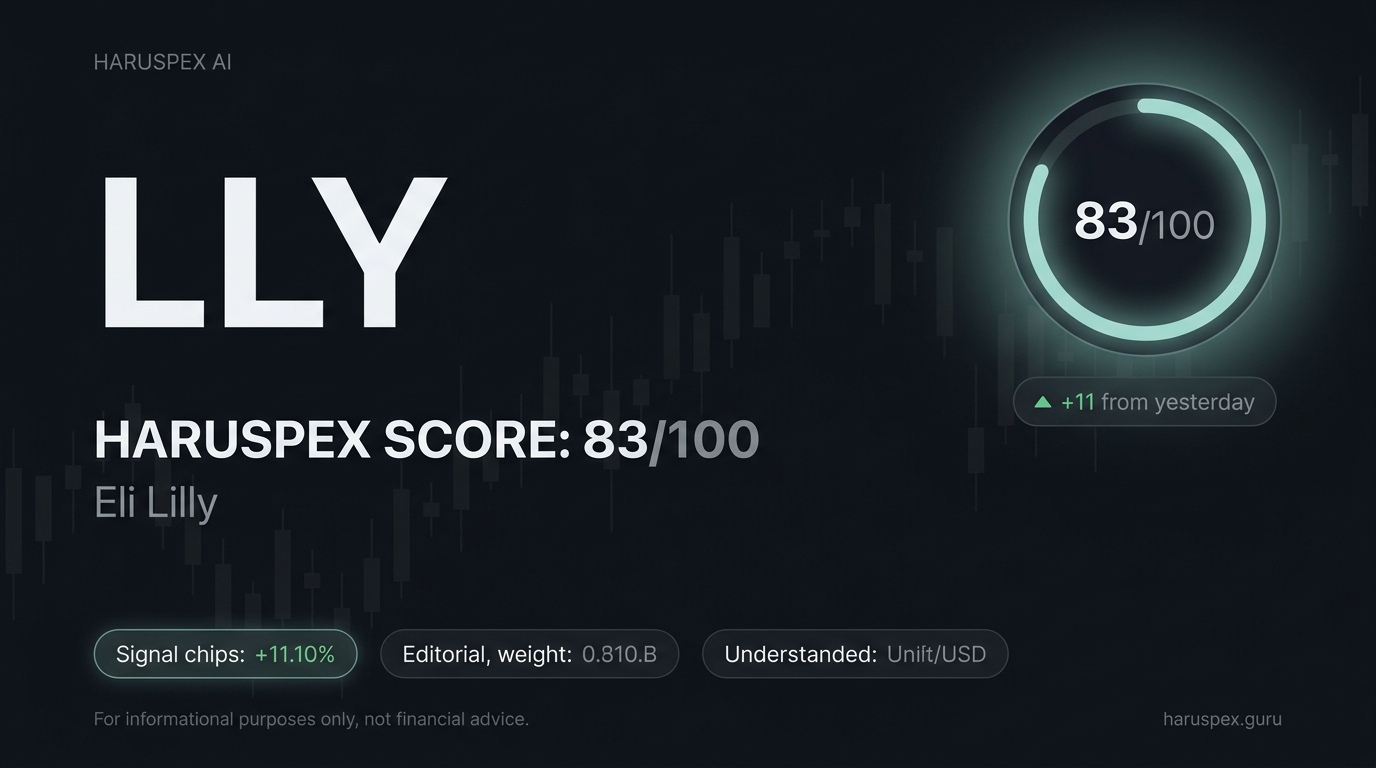
The surge in the macro_pressure dimension suggests that broad economic indicators, such as inflation expectations, GDP growth forecasts, and central bank sentiment, are becoming increasingly favorable. Top stocks influenced by this dimension include LLY, NVDA, and AMZN, indicating that these market leaders are benefiting from or contributing to improved economic conditions.
Beyond macro, the regulatory_environment dimension also showed a notable positive shift, rising +1.3 points to an average score of 63.0. This increase suggests a more favorable or less restrictive environment for businesses, particularly impacting bellwether stocks like LLY, NVDA, and AAPL. Reduced regulatory headwinds can boost investor confidence.
Further reinforcing the bullish sentiment are the consistently high scores in the short-interest dimension, averaging 66.7, and the institutional_flow dimension, averaging 66.4. The high short-interest scores for stocks like BA, HON, and PLTR may indicate short-squeeze potential or a bullish divergence. Sustained institutional buying pressure in names like HON, NVDA, and NUE confirms robust investor confidence.
The earnings_momentum dimension, at 63.6, and the competitors_analysis dimension, at 60.2, also contribute to the overall bullish picture. Strong earnings signals for stocks such as MU and LLY, coupled with favorable competitive positioning for NVDA and LLY, indicate healthy company fundamentals supporting market upward pressure.
Regime Thresholds
The current bullish thesis largely holds as long as key macro indicators remain within supportive ranges. Specifically, the market maintains its positive directional edge if the S&P 500 consistently closes above 7,500. Additionally, a VIX sustained below 18 and the 10-Year Treasury Yield remaining below 4.5% will continue to fuel investor appetite for equities.
Risk Factors
While broad market signals lean bullish, some dimensions present cautionary data. The insider_trading dimension remains significantly bearish, scoring only 32.3. Top stocks like TSLA, AMZN, and BRK.B show high levels of insider selling, which can signal management's concern about near-term prospects, contrasting with other bullish signals.
Geopolitical risks persist, as indicated by the us_china_unofficial (39.3) and us_china_official (39.0) dimensions, which show persistent bearish pressure. This suggests underlying tensions that could impact global supply chains and trade-sensitive sectors. Investors should monitor developments in this area for potential market-wide impact.
The climate_risk dimension experienced a slight decrease, scoring 52.7 with a -0.5 change. While not strongly bearish, this indicates a slight cooling of positive signals related to environmental factors. Investors focusing on ESG metrics might find this a slight detractor from their thesis.
What Would Change This View
The current bullish pressure thesis would face invalidation under specific measurable conditions. If the S&P 500 closes below the 7,500 level for two consecutive trading days, this would signal a significant breakdown of technical support. A sustained rise in the VIX above 20 would indicate a return of elevated market fear, altering the current low-volatility regime.
Furthermore, any abrupt negative shift in global central bank policy or unexpected deterioration in key economic growth data that causes the macro_pressure dimension to reverse its recent gains significantly would challenge the prevailing positive outlook. A rapid increase in the 10Y Treasury Yield above 4.6% could also shift market dynamics.
Outlook
Haruspex AI’s analysis for June 2, 2026, points to a market benefiting from robust macro tailwinds and consistent institutional interest. The significant bullish shift in the macro_pressure dimension, alongside strong regulatory and short-interest signals, suggests a favorable environment for many equities. However, prudent investors should remain cognizant of the persistent insider selling and lingering geopolitical risks.
The near-term outlook remains cautiously optimistic, with a strong emphasis on sectors and individual names showing positive directional pressure across multiple AI dimensions. Monitoring macro shifts and specific insider activity will be crucial for navigating potential volatility in the coming weeks.


