
TL;DR: Haruspex AI detected widespread bullish market pressure on June 5, 2026, with 128 bullish signals across 174 analyzed stocks. Micron (MU) recorded the highest bullish pressure score of 85.0, driven by strong earnings and technical momentum. Investors should monitor shifts in macro indicators for potential regime changes.
The trading day on 2026-06-05 ET concluded with prevailing bullish sentiment, as 128 out of 174 stocks analyzed by Haruspex AI displayed positive directional pressure. Only 10 stocks registered bearish signals, highlighting a broad market favoring upward movements. This robust sentiment drove the S&P 500 to a gain of 0.41%.
Haruspex AI's deep learning models identified significant directional pressure in key technology and financial sectors. Micron (MU) emerged as a standout performer, leading the market with a strong bullish pressure score of 85.0. This reflected strong underlying forces that conventional analysis might understate.
Macro Regime Monitor
The broader market environment showed continued stability with key indicators remaining within bullish thresholds. The VIX, a measure of market volatility, remained subdued, signaling investor confidence. Treasury yields maintained a relatively stable posture, supporting risk-on assets.
| Metric | Current | Key Level |
|---|---|---|
| S&P 500 | 7,584.31 (+0.41%) [data: 2026-05-25 close] | 7,500.00 |
| VIX | 15.74 [data: 2026-05-25 close] | 16.00 |
| 10Y Treasury Yield | 4.54% [data: 2026-05-25 close] | 4.50% |
| WTI Crude Oil | $92.52 [data: 2026-05-25 close] | $90.00 |
| US Dollar Index (DXY) | 99.48 [data: 2026-05-25 close] | 100.00 |
What Haruspex AI Detected
Haruspex AI employs a sophisticated framework to analyze market dynamics, going beyond traditional metrics. It processes millions of data points across numerous dimensions, including sentiment, technical indicators, institutional flows, and supply chain pressures. This allows for the identification of subtle shifts in market directional pressure.
On June 5, 2026, the AI's collective intelligence highlighted a significant tilt towards bullish sentiment. The system observed a pronounced strengthening in the technical_momentum dimension across various sectors. Furthermore, positive shifts in the options_flow and institutional_flow dimensions signaled increased buying interest from large players.
The AI's deep learning models correlate these dimensional movements to forecast market behavior, providing a unique edge. This multi-dimensional approach often reveals market signals that might be overlooked by conventional fundamental or technical screens. The current broad bullishness is a testament to these comprehensive insights.
What Drove Micron (MU) to an 85.0 Bullish Score?
Micron Technology (MU) registered a strong bullish pressure score of 85.0, representing a +5.0 point increase. This significant upward directional signal was primarily driven by exceptional readings in its earnings dimension, which scored 85. The market's anticipation of robust financial performance is a key factor.
Further bolstering the bullish pressure for MU were strong signals from the short-interest dimension, rising to 72, indicating reduced bearish bets. Concurrently, the technical_momentum dimension also scored 72, suggesting sustained upward price action and strong buyer support. These combined factors indicate strong underlying market conviction.
Cisco Systems (CSCO) recorded a bullish pressure score of 83.0, despite a marginal -1.0 point change. The options_flow dimension at 75 showed significant bullish positioning by options traders. The earnings dimension scored 72, reflecting solid company performance.
The institutional_flow dimension for CSCO also stood at 72, indicating consistent buying from major investment firms. This buyer-seller imbalance heavily favors the bulls. The market's directional signal for Cisco remains firmly positive, with strong institutional backing.
Morgan Stanley (MS) showed a strong bullish pressure score of 83.0, reflecting similar dynamics to Cisco. The technical_momentum dimension scored 75, underscoring strong price trends. Its options_flow dimension was 72, pointing to bullish derivative activity.
Additionally, the earnings dimension for MS registered a score of 70, supporting the overall positive outlook. Despite a minor -1.0 point adjustment, the overall market pressure for Morgan Stanley remains robust. The data indicates continued confidence from market participants.
Nucor Corporation (NUE) saw a notable +5.0 point increase, reaching a bullish pressure score of 82.0. This surge was primarily driven by the institutional_flow dimension, scoring 75, indicating increased large-scale investment. The earnings dimension scored 72, reinforcing fundamental strength.
The technical_momentum dimension for NUE also reached 72, suggesting upward price continuation. These combined factors highlight a strong directional edge, fueled by institutional confidence and solid company performance. The steel producer shows compelling market pressure.
Eli Lilly and Company (LLY) maintained a strong bullish pressure score of 79.0. A standout earnings dimension score of 85 signifies exceptional financial health and market perception. The competitors dimension scored 72, suggesting a strong position relative to industry rivals.
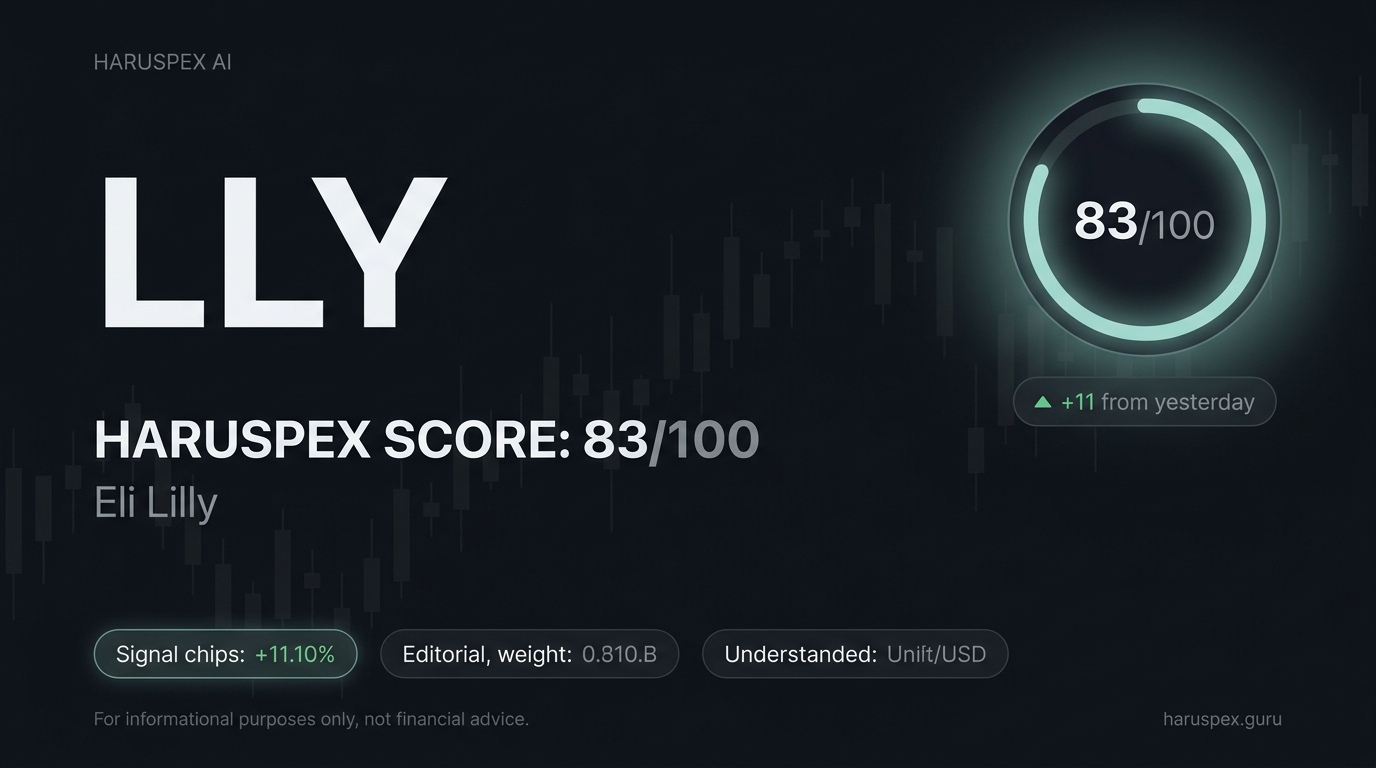
The institutional_flow dimension for LLY stood at 68, indicating ongoing, albeit slightly moderated, institutional interest. This stable score, despite no change, reflects a strengthening directional edge within the competitive pharmaceutical landscape. The market continues to favor Eli Lilly.
PNC Financial Services (PNC) posted a significant +7.0 point gain, achieving a bullish pressure score of 81.0. This sharp increase was driven by a robust earnings dimension score of 78. Both the institutional_flow and options_flow dimensions also scored 72, pointing to strong buyer activity.
This confluence of positive signals suggests a strengthening directional edge for PNC compared to its peers. The significant uptick in multiple dimensions indicates growing market confidence in the financial institution. This makes it a strong contender for continued bullish pressure.
Apple Inc. (AAPL) held a bullish pressure score of 74.0, despite a slight -1.0 point change. The earnings dimension, scoring 72, continues to reflect strong fundamental performance. Institutional interest, as measured by the institutional_flow dimension, remained high at 70.
The competitors dimension for AAPL scored 68, indicating its robust positioning within the tech sector. Even with a minor adjustment, the overall market directional pressure remains bullish. Apple's established market presence provides a strong foundation for this sustained positive signal.
Risk Factors
- Inflationary Pressures: Elevated WTI Crude Oil prices above $90 per barrel could reignite inflation concerns, potentially prompting hawkish central bank policies. This may introduce headwinds for growth stocks.
- Interest Rate Sensitivity: A sudden upward shift in the 10Y Treasury Yield beyond 4.60% could increase borrowing costs for corporations. This would negatively impact earnings outlooks, particularly for highly leveraged firms.
- Geopolitical Volatility: Unforeseen global events impacting supply chains or trade relations could disrupt corporate operations and consumer confidence. Such events tend to trigger broad market corrections.
Regime Thresholds
The current market thesis of prevailing bullish pressure remains intact under specific macro conditions. This optimistic outlook is predicated on key indicators holding their current levels. Deviations from these thresholds would warrant a re-evaluation of the market's directional bias.
- S&P 500: The bullish regime holds as long as the S&P 500 maintains its position above 7,500. A sustained break below this level would signal a shift in market sentiment.
- VIX: Continued market calm is indicated by the VIX remaining below the 16.00 threshold. A surge above 18.00 would suggest increasing fear and potential volatility.
- 10Y Treasury Yield: Stability is maintained if the 10Y Yield stays below 4.60%. A move above this level could pressure equities and signify higher cost of capital.
- WTI Crude Oil: Energy cost headwinds are manageable while WTI Crude Oil stays below $95.00. Exceeding this could re-ignite broad inflationary concerns.
What Would Change This View
A shift from the current bullish directional pressure would require specific, measurable conditions to materialize. Haruspex AI constantly monitors these thresholds for early warnings of regime change. Investors should remain vigilant to these potential shifts.
- If the S&P 500 were to close below the 7,500 level for two consecutive trading sessions, it would invalidate the current broad bullish market pressure thesis. This would signal a significant change in investor sentiment.
- Should the VIX index rise above 18.00 and hold that level for three consecutive trading sessions, it would suggest a return of significant market fear. This would challenge the current low-volatility, risk-on environment.
- A sustained upward move in the 10Y Treasury Yield, breaking above 4.65% and holding for a week, would signal increasing concerns over inflation or tighter monetary policy. This would likely create headwinds for equity valuations.
Market Outlook
Haruspex AI's analysis for Friday, June 5, 2026, reinforces a strong bullish market bias. The sheer volume of bullish signals (128 out of 174 stocks) and the performance of bellwether stocks like Micron (MU) indicate robust underlying strength. Key dimensions like earnings, technical momentum, and institutional flow are driving this positive directional pressure.
While macro indicators remain supportive, vigilance is warranted regarding potential shifts in inflation or interest rate narratives. Investors are encouraged to leverage Haruspex AI's deep, multi-dimensional insights to navigate this dynamic environment. The prevailing data suggests continued opportunities within this bullish regime.


